Review of Regional Weather for November 2021
1. Overview
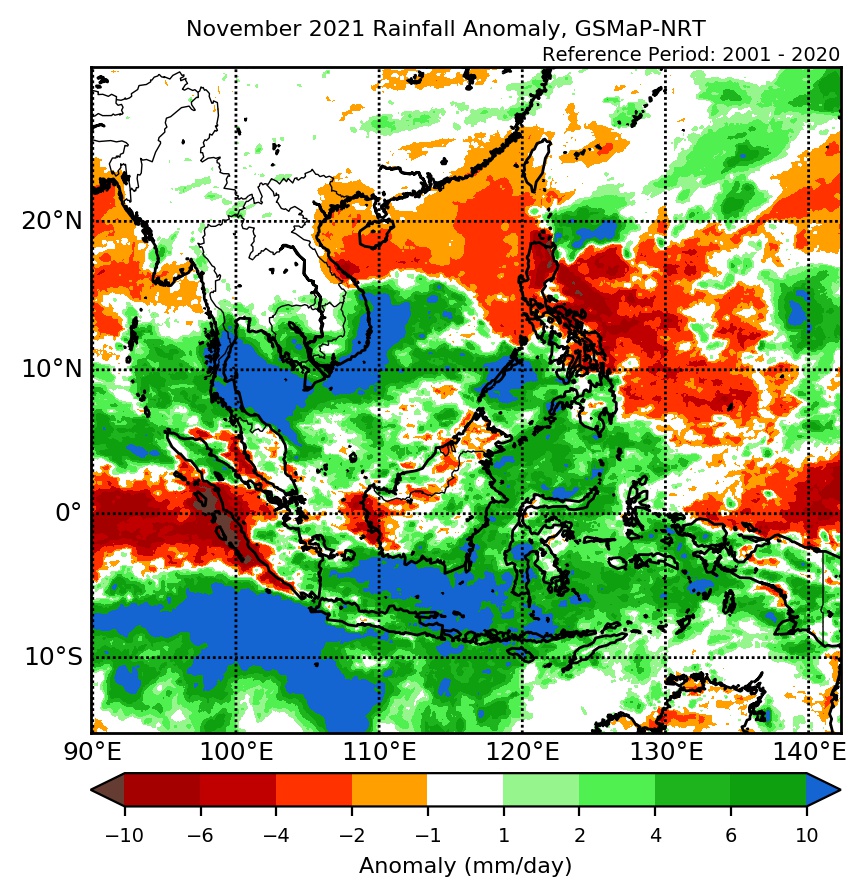
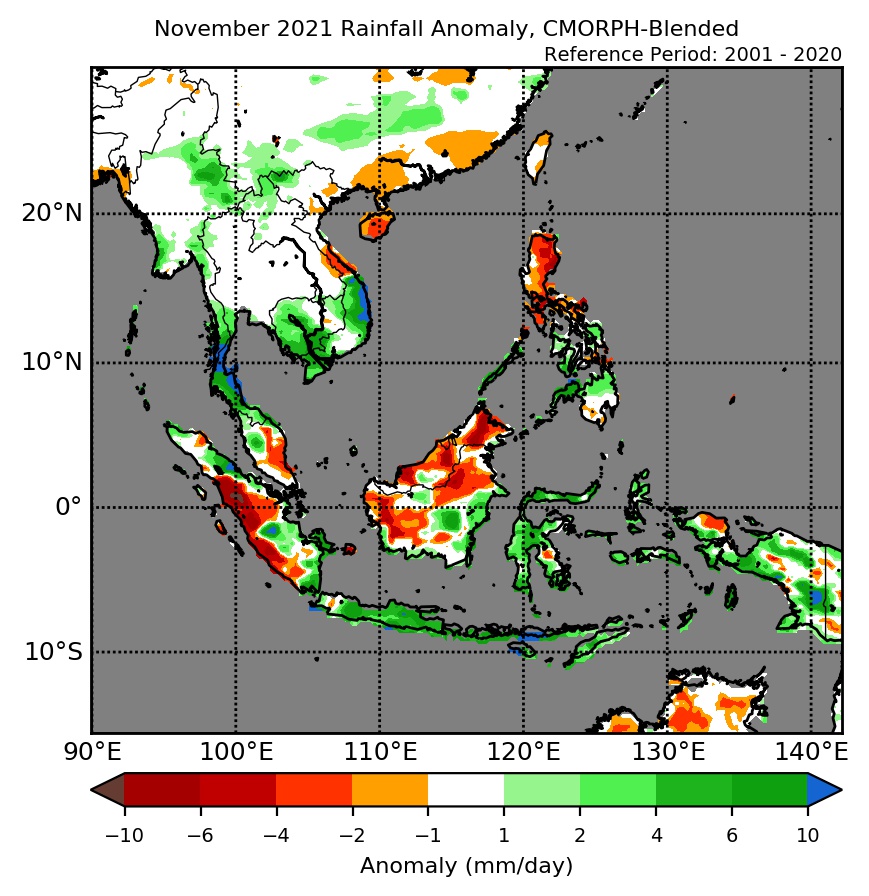
1.1 During November 2021, a mix of below- to above-average rainfall was recorded over the Maritime Continent, while near-average rainfall was recorded over much of Mainland Southeast Asia, except for above-average rainfall recorded over southern Mainland Southeast Asia (Figure 1). The largest positive anomalies (wetter conditions) were recorded over southern Mainland Southeast Asia for both satellite-derived rainfall estimates datasets (GSMaP-NRT and CMORPH-Blended). The largest negative anomalies (drier conditions) were recorded over central Sumatra and the Philippines, with larger negative anomalies based on CMORPH-Blended data compared to GSMaP-NRT.
1.2 The observed rainfall anomaly pattern of a mix of below- to above-average rainfall for the Maritime Continent and the above-average rainfall for southern Mainland Southeast Asia are broadly consistent with the predictions from the subseasonal weather outlooks for November 2021 (1 – 14 November and 15 – 28 November).
1.3 Above average temperature was recorded over western Mainland Southeast Asia, the western Maritime Continent, as well as the northern Philippines and eastern Indonesia. Below-average temperature was recorded over northeastern Mainland southeast Asia and southern Indonesia (Figure 2). Elsewhere, near-average temperature was recorded. The largest positive anomalies (warmer temperatures) were over western Myanmar, and largest negative anomalies (cooler temperatures) were over northern Viet Nam and eastern Java.

2. Climate Drivers
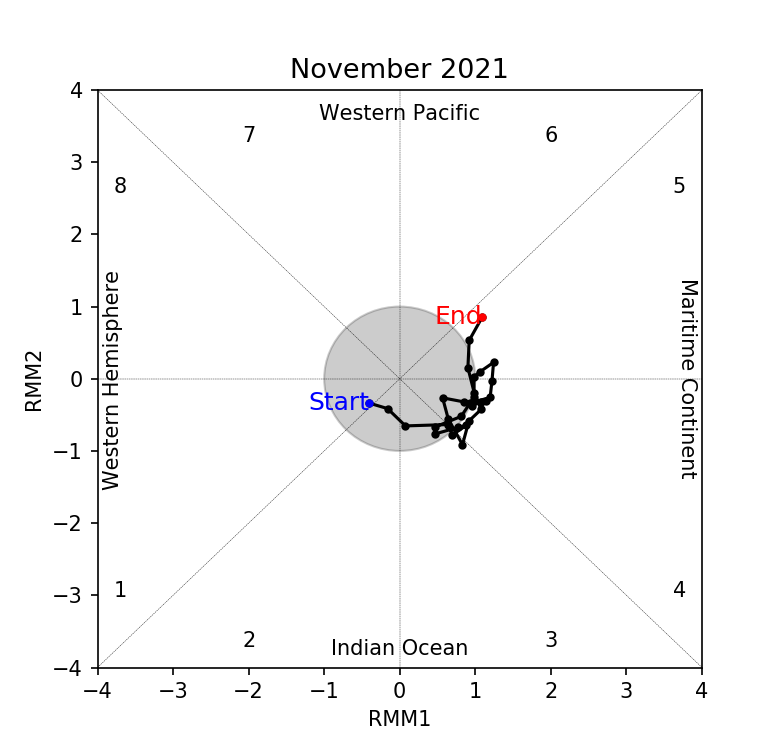
2.1 There was no Madden-Julian Oscillation (MJO, Figure 3) present at the start of November 2021, based on the MJO phase diagram below. From second week of November onwards, there were signs of a MJO signal over the Maritime Continent (Phases 4 and 5). However, this signal was not very coherent and likely influenced by the background La Niña conditions. Phases 4 and 5 tend to bring wetter conditions to parts of the ASEAN region around 10°N, while Phase 5 tends to bring drier conditions to the western Maritime Continent.
2.2 La Niña conditions were present over the tropical Pacific. Sea surface temperatures in the Nino3.4 region (used to monitor ENSO) and the atmospheric indicators over the tropical Pacific Ocean were consistent with La Niña conditions. La Niña events tend to bring wetter-than-average conditions to much of Southeast Asia during the September to November period.