Review of Regional Weather and Smoke Haze for Mar 2018
1. Review of Regional Weather Conditions in March 2018
1.1 The Northeast Monsoon conditions continued to prevail in Southeast Asia in March 2018. Dry air from the northern Asian landmass brought dry conditions to many parts of Southeast Asia, extending as far south as over Peninsular Malaysia. The northern ASEAN region remained in the midst of the traditional dry season, while wetter conditions were experienced in the south with the monsoon trough and its associated rain band lying close to the Equator.
1.2 In the northern ASEAN region, drier conditions were observed over Myanmar, northern Thailand and parts of Cambodia and Thailand while near to above-normal rainfall was felt over other parts of the region.
1.3 In the southern ASEAN region, parts of Peninsula Malaysia and northern Sumatra experienced below-normal rainfall.
1.4 The rainfall distribution for March 2018 and the percentage of normal rainfall for March 2018 are shown in Figure 1 and 2.

Figure 1: Daily average rainfall for the ASEAN region in March 2018. (Source: JAXA Global Satellite Mapping of Precipitation).
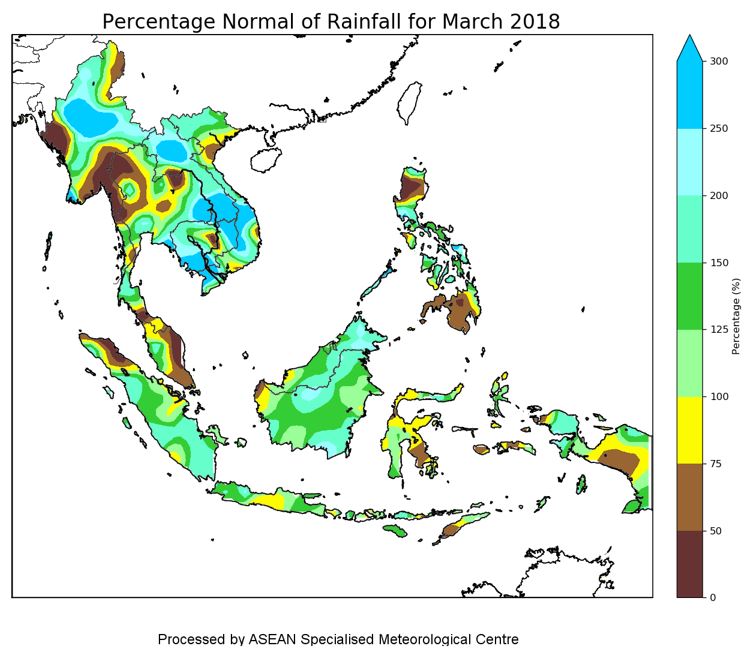
Figure 2: Percent of Normal Rainfall for March 2018. The rainfall data may be less representative for areas with a less dense rainfall network.
1.5 In March 2018, winds north of the Equator were predominantly from the east or southeast, while at and south of the Equator, the winds were generally from the west or north. During the month, strong anomalous northerly winds were observed over the Philippines. Stronger westerly winds were also observed between latitudes 8ºN and 8ºS, and longitudes 125ºE and 140ºE. Figure 3 shows the average and anomalous winds at 5000 feet.


Figure 3: 5000 ft average winds (left) and anomaly (right) for March 2018.
1.6 During the month, the cool anomalies of the equatorial Pacific Ocean’s sea surface temperature (SST) over the Niño 3.4 region indicated neutral conditions (neither El Niño or La Niña) values. Trade winds and cloudiness over the equatorial Pacific Ocean has returned to near-average levels, which is also consistent with a neutral state.
1.7 During the first half of March 2018, the Madden Julian Oscillation (MJO) progressed through Phase 3, before gradually weakening towards the end of week 2. The MJO in Phase 3 typically brings slightly enhanced rainfall over the equatorial Southeast Asia region during this period of the year. However, the MJO event did not bring significant rainfall anomaly to the region in March 2018. For the rest of the month, the MJO signal remained weak.

Figure 4: The MJO phase diagram for March 2018 (green). The diagram illustrates the movement of the MJO through different phases, which correspond to different locations along the equator. The distance of the index from the centre of the diagram is correlated with the strength of MJO. When the index falls within the circle, the MJO is considered weak or indiscernible. (Source: Bureau of Meteorology).
2. Review of Land/Forest Fires and Smoke Haze Situation
2.1 In March 2018, the hotspot counts in the northern ASEAN region remained elevated as dry weather conditions prevailed. In particular, the number of hotspots observed over Myanmar had increased compared to early 2018. Persistent haze was observed over parts of Myanmar on many days. Elsewhere, scattered hotspots with localised smoke plumes were observed on occasions.
2.2 In the southern ASEAN region, hotspot conditions were generally subdued due to prevailing wet conditions.
2.3 Satellite images showing the hotspots detected in the ASEAN region in March 2018 are given in Figure 5 to Figure 8.

Figure 5: NOAA-19 satellite image on 11 March 2018 shows scattered hotspots over Cambodia. A thin smoke plume was observed in the vicinity of a hotspot.

Figure 6: NOAA-19 satellite image on 20 March 2018 shows scattered hotspots with smoke plumes near the border between Myanmar and Thailand.

Figure 7: NOAA-19 satellite image on 23 March 2018 shows cluster of hotspots with smoke haze in southern part of Lao PDR.

Figure 8: NOAA-19 satellite image on 20 March 2018 shows shower activities affected most parts of the southern ASEAN region.
2.4 The hotspot distribution and daily hotspot charts for March 2018 are shown in Figure 9, Figure 10 and Figure 11.


3. Status of El Niño/La Niña and Indian Ocean Dipole
3.1 Based on experts’ assessments from international climate centres, the prevailing La Niña conditions weakened and transitioned to neutral (neither El Niño nor La Niña) conditions in March 2018. The neutral conditions are expected to last until the third quarter of 2018.
3.2 In March 2018, the Indian Ocean Dipole (IOD) index remained at neutral levels (Figure 12). In the coming months, international climate models forecast the IOD to remain neutral, with some chance that a negative IOD may develop later in the year. The IOD is not likely to have a significant influence on the weather over the region. The formation of IOD typically starts around May or June, and peaks between August and October before decaying rapidly between February and April.

Figure 12: Indian Ocean Dipole (IOD) index time series. The IOD index was at neutral levels in March 2018. (Source:
Bureau of Meteorology, Australia).