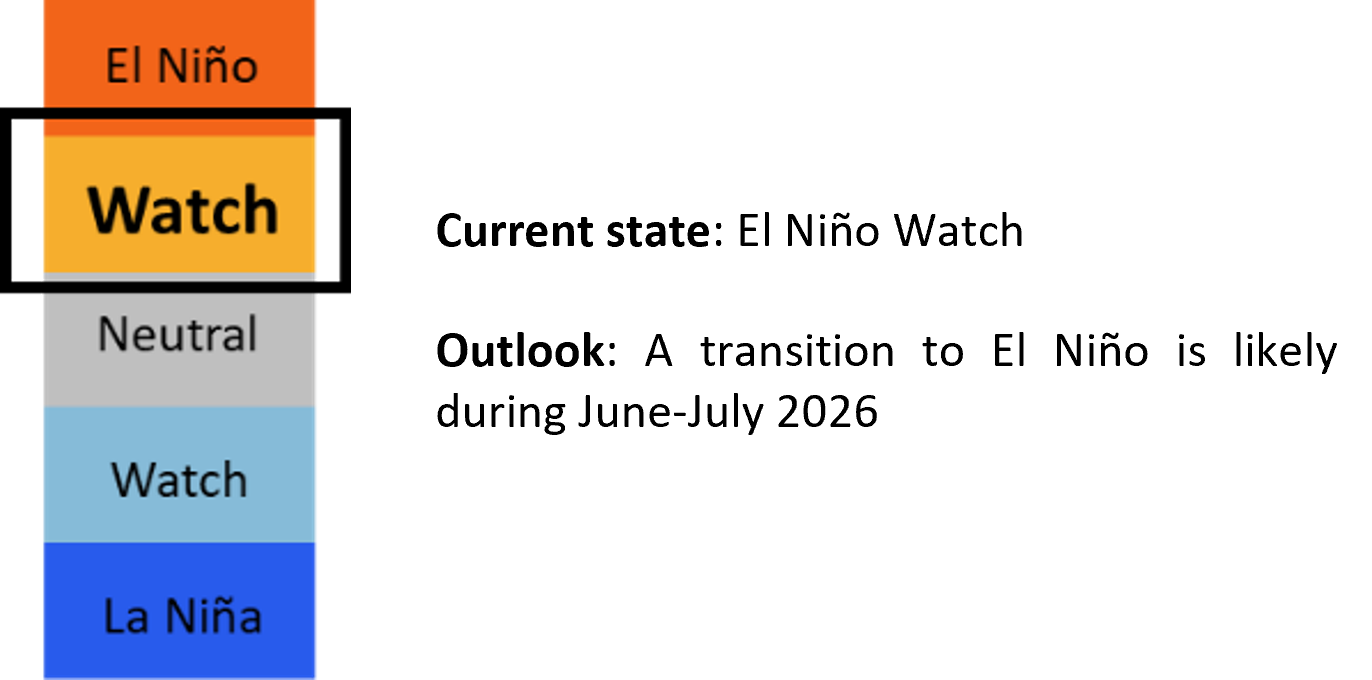
The El Niño – Southern Oscillation (ENSO) monitoring system state is “El Niño Watch”. The Nino3.4 index was within the ENSO-neutral range in April 2026, however there are signs in the tropical Pacific that support El Niño conditions developing (e.g., sustained warmer subsurface ocean temperatures). Key atmospheric indicators (cloudiness and trade wind anomalies) supported ENSO-neutral conditions overall in April. The Nino3.4 index was 0.14°C for April 2026 and -0.47°C for the three-month average February – April 2026 based on the Relative Oceanic Nino Index.
ENSO-neutral conditions are predicted to persist in May 2026, with a transition to El Niño conditions predicted in June-July 2026.
Short note on the Indian Ocean Dipole: The Indian Ocean Dipole (IOD) is neutral and predicted to remain neutral until at least June 2026. There is potential for a positive IOD to develop in July-August 2026.
Further Information on ENSO
ENSO conditions are monitored by analysing Pacific sea surface temperatures (SSTs), low level winds, cloudiness (using outgoing longwave radiation), and subsurface temperatures. Special attention is given to SSTs, as they are one of the key indicators used to monitor ENSO. Here, three different datasets are used: HadISST, ERSSTv5, and COBE datasets. As globally, SSTs have gradually warmed over the last century under the influence of climate change, the SST values over the Nino3.4 will increasingly be magnified with time, and hence appear warmer than they should be. Therefore, this background trend is removed from the SST datasets (Turkington, Timbal, & Rahmat, 2018), before calculating SST anomalies using the climatology period 1976-2014. So far, there has been no noticeable background trend in the low-level winds or cloudiness.
El Niño (La Niña) conditions are associated with warmer (colder) SST anomalies in the central and eastern Pacific. The threshold for an El Niño (La Niña) in the Nino3.4 Region is above 0.65°C (below -0.65°C). El Niño (La Niña) conditions also correspond to an increase (decrease) in cloudiness around or to the east of the international dateline (180°), with a decrease (increase) in cloudiness in the west. There is also a decrease (increase) in the trade winds in the eastern Pacific. Sub-surface temperatures in the eastern Pacific should also be warmer (colder) than average, to sustain the El Niño (La Niña) conditions.
For ENSO outlooks, information from the World Meteorological Organization (WMO) and international climate centres are assessed. The centres include the Climate Prediction Center (CPC) USA, the Bureau of Meteorology (BoM) Australia, as well as information from the International Research Institute for Climate and Society (IRI) which consolidates model outputs from other centres around the world. Each centre uses different criteria, including different SST thresholds, suitable for their own region and applications. Therefore, variations between centres on the current ENSO state should be expected, especially when conditions are borderline.
The sea surface temperatures (SSTs) in the tropical Pacific in April 2026 were below- to near-average in the central portion of the region and near- to above-average in the west (Figure 1). The cool (negative) anomalies in the Nino3.4 region (red box) have further reduced compared to the previous month, indicative of neutral conditions during April. Across the Indian Ocean, SSTs were near-average or slightly above-average for most of the equatorial region, indicative of a neutral IOD state.
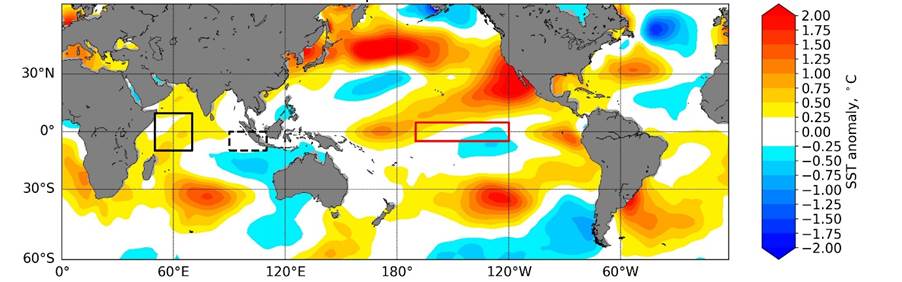
Figure 1: Detrended SST anomalies for April 2026 with respect to 1976-2014 climatology using ERSST v5 data. Red (blue) shades show regions of relative warming (cooling). The tropical Pacific Ocean Nino3.4 Region is outlined in red. The Indian Ocean Dipole index is the difference between average SST anomalies over the western Indian Ocean (black solid box) and the eastern Indian Ocean (black dotted box).
Looking at the Nino3.4 index in Figure 2, the 1-month Nino3.4 index first passed the La Niña threshold in December 2024 and returned to ENSO neutral in March 2025. The index passed the La Niña threshold in September 2025 and returned to the neutral range in February 2026. For La Niña conditions to be present, 1-month cold SST anomalies (observed or forecast) should persist for at least four months below the threshold, with at least one of the months observed; along with supporting atmospheric observations.
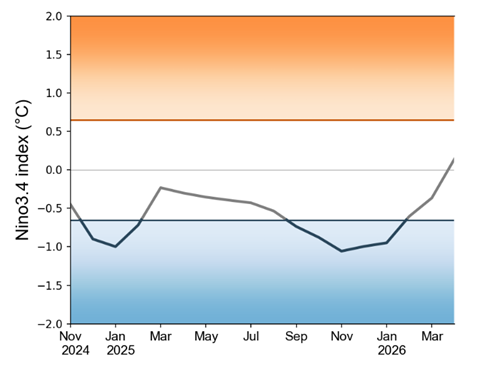
Figure 2: The Nino3.4 index using the 1-month SST anomalies. Warm anomalies (≥ +0.65; brown) correspond to El Niño conditions while cold anomalies (≤ -0.65; blue) correspond to La Niña conditions; otherwise neutral (> -0.65 and < +0.65; grey).
Model outlooks from Copernicus C3S (Figure 3), based on the Relative Nino3.4 SST index, predict the index to continue warming, with a transition to El Niño conditions very likely during June-July 2026. The El Niño conditions are predicted to persist at least until October 2026, with most models predicting the strength of the El Niño conditions to be moderate or strong. However, there is still uncertainty in the long-term forecasts at this time of the year, therefore the strength of the predicted El Niño conditions is uncertain.
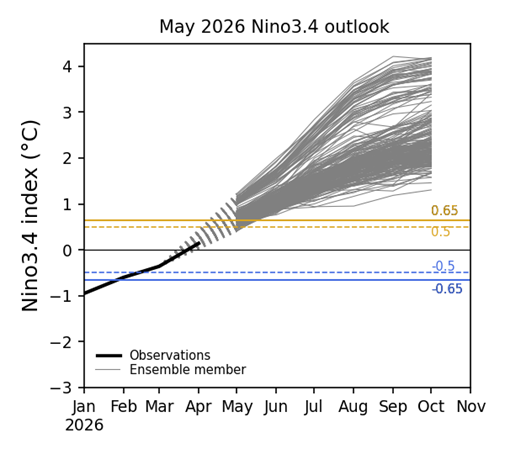
Figure 3: Forecasts of Nino3.4 index’s strength until October 2026 from various seasonal prediction models from international climate centres (grey lines). The blue and yellow lines note the La Niña and El Niño thresholds, respectively, used by various centres.
Historical ENSO Variability
To classify a historical El Niño event, the 3-month average Nino3.4 value must be above 0.65°C for 5 or more consecutive months. For La Niña events, the threshold is -0.65°C. Otherwise it is considered neutral. ENSO events with a peak value above 1.5°C (El Niño) or below -1.5°C (La Niña) are considered strong. Otherwise, the events are considered weak to moderate in strength. The following figure (Figure 4) shows the development of the Nino3.4 index for the most recent El Niño and La Niña events in comparison to other El Niño/La Niña events.
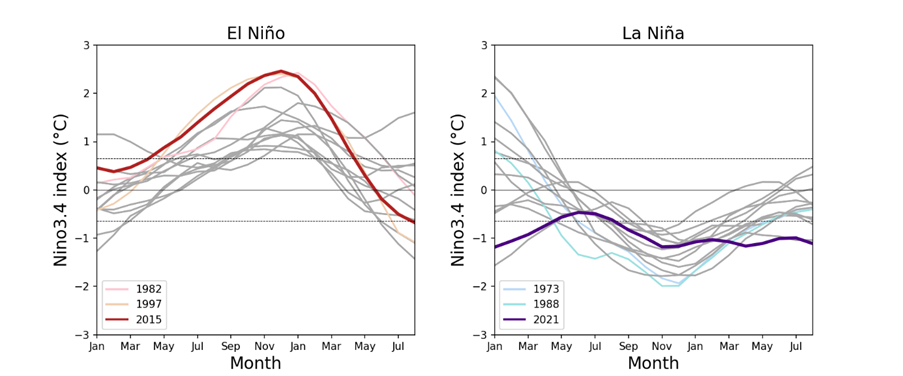
Figure 4: Three-month Nino3.4 index development and retreat of different El Niño (left)/La Niña (right) events since the 1960s. Recent El Niño and La Niña events are in red and purple, respectively.
Impact of El Niño/La Niña on Southeast Asia
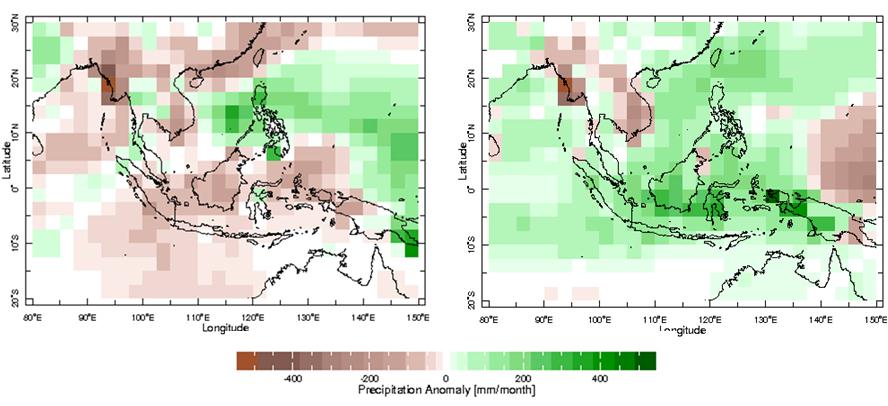
The typical impact of La Niña on Southeast Asia is wetter-than-average rainfall conditions, including for much of the Maritime Continent during June – August (Figure 5, right). The opposite conditions for rainfall (and consequently temperature) are observed during El Niño years (Figure 5, left).
The impact on the region’s rainfall and temperature from ENSO events is more significantly felt during strong or moderate-intensity events. Also, no two El Niño events or two La Niña events are exactly alike in terms of their impact on the region.
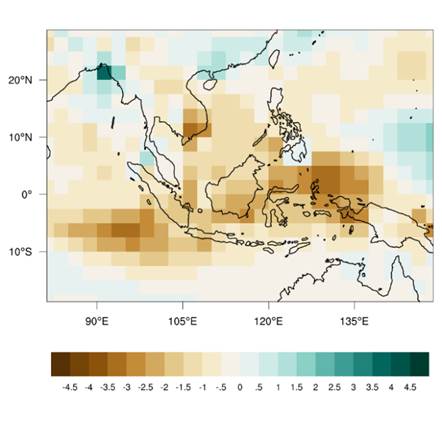
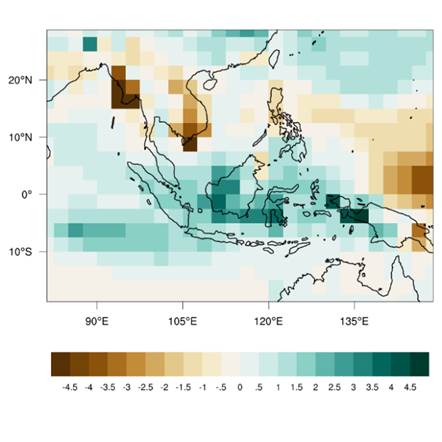
Figure 5: June to August (JJA) season rainfall anomaly composites (mm/day) for El Niño (left) and La Niña (right) years. Brown (green) shades show regions of drier (wetter) conditions. Note that this anomaly composite was generated using a limited number of El Niño and La Niña occurrences between 1979 and 2017 and therefore should be interpreted with caution (data: NOAA CPC CAMS_OPI).
References
Turkington, T., Timbal, B., & Rahmat, R. (2018). The impact of global warming on sea surface temperature based El Nino Southern Oscillation monitoring indices. International Journal of Climatology, 39(2).
El Niño/La Niña
-
For El Niño/La Niña updates, information provided by the World Meteorological Organization (WMO) and various international climate centres are assessed. The centres include the Climate Prediction Center (CPC) USA, the Bureau of Meteorology (BoM) Australia, as well as information from the International Research Institute for Climate and Society (IRI) which consolidates model outputs from various other centres around the world.
Frequently Asked Questions
What is El Niño/La Niña and how do they affect weather in South East Asia?
The El Niño phenomenon is a non-regular occurrence in the tropical pacific region where warmer waters develop over the Eastern Tropical Pacific Ocean along the coast of South America. In South East Asia, this brings drier weather and increases the risk of forest fires and smoke haze. The La Niña phenomenon is the reverse of the El Niño where cooler waters develop over the Eastern Tropical Pacific Ocean along the coast of South America.
In South East Asia, higher than normal rainfall tends to occur during a La Niña episode which may result in an increased occurrence of floods.
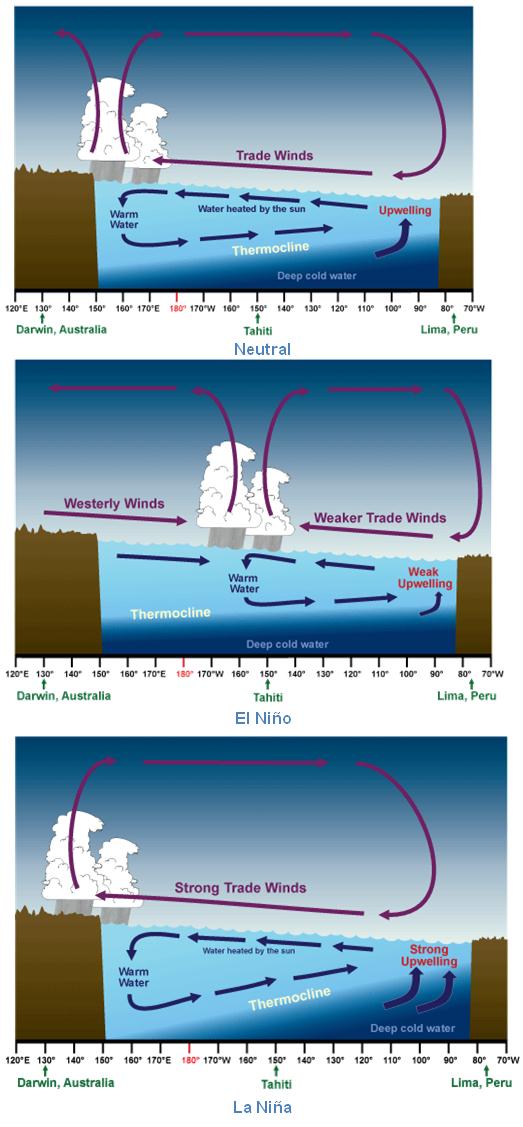
Cross section of El Niño, neutral and La Niña conditions across the Tropical Pacific Ocean. (Image credit: NOAA)
The correlation between El Niño/La Niña and its associated weather impacts on South East Asia differ from one place to another and for different seasons.
Distribution of precipitation anomalies over South East Asia (Jun – Oct) for El Niño (left) and La Niña (right) years. (Image credit: IRI Climate)
The image above shows the precipitation anomalies averaged over the El Niño and La Niña years. For instance, the impact of El Niño is typically stronger over the southern and eastern part of South East Asia during the months of Jun – Oct.