Most frequently asked questions
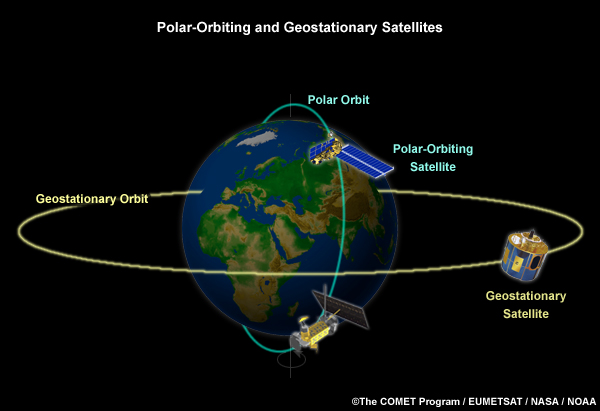
The South East Asia region covers a large area of approximately 4.5 million km2. Land fires can occur in remote locations, away from populated areas and they usually spread over large distance. Over the years, weather satellites have become the most important and convenient observational tool in the monitoring of weather and environmental conditions. These weather satellites are the Polar Orbiting and Geostationary Satellites.
| Polar-Orbiting Satellites | Geostationary Satellites |
|---|---|
| Polar-orbiting satellites circle the Earth in an almost north-south orbit, passing close to both poles. The orbits are sun synchronous, allowing the satellites to cross the equator at the same local time each day. They orbit at a height of between 830 and 880 km and take about 100 minutes to complete an orbit.
These satellites only pass through the same region twice daily and are able to provide data with high spatial resolution due to their relatively low altitude. They are also equipped with more sensors onboard and therefore able to map the weather and atmospheric conditions in greater detail than geostationary satellites. |
Geostationary satellites circle the Earth above the equator at altitudes of about 36,000 km in a geosynchronous orbit i.e. they orbit the equatorial plane of the Earth at a speed matching the Earth’s rotation. This allows them to remain stationary with respect to the rotating Earth and thus provide images of the entire hemisphere below continuously. |
The ASMC receives and processes satellite information in real-time before making the information available to various end-users for operational monitoring of hotspots and smoke haze in the region. ASMC receives data from the polar orbiting satellites – NOAA series, EOS Terra and Aqua, and from the geostationary satellites – MTSAT-2, FY2-D and FY2-E.
In addition to monitoring via satellite remote sensing, ASMC makes use of the regional weather and air quality observation networks for near real-time ground observation data in its assessment. However, such ground data is often limited by the sparse distribution of ground stations in our region.
Land fires on the ground emit spectral signals that are characterised by higher emissions of mid-infrared radiation. Such thermal anomalies are exploited by fire detection algorithms to determine whether a particular pixel observed by the satellite’s sensor is or is not associated with a forest fire. If a particular pixel is flagged to be a fire, it is indicated as a hotspot. The fire detection algorithm, also referred to as a contextual algorithm, compares the values of suspected fire pixels against a set of absolute thresholds, and with values of surrounding pixels.
Depending on the size and proximity of fires, they may or may not appear as separate hotspots. If the total size of fire detected is of sub-pixel size, it will appear as a single hotspot. As for active fires with size bigger than a pixel, they will appear as multiple hotspots.
It is important to note that a hotspot detected does not always correspond to actual land fires. Other high temperature bodies may also exhibit similar thermal properties as land fires. Examples are gas flares and power plants.

(Source: NASA)
The hotspots published by ASMC are observed using the NOAA-18 satellite Advanced Very High Resolution Radiometer (AVHRR) sensor.
To help identify and highlight different features such as hotspots, smoke plumes/haze and clouds, the data from a combination of spectral channels are used to form a multi-spectral image.
Three primary colours of red, green, blue (RGB) are assigned to selected spectral channels of NOAA, AQUA and TERRA satellites. In particular, the polar-orbiting satellite images that ASMC produces are based on the following colour-to-channel assignment:
| RED | Visible band |
| GREEN | Near-infrared (NIR) Band |
| BLUE | Long-wavelength Infrared (LWIR) Band |
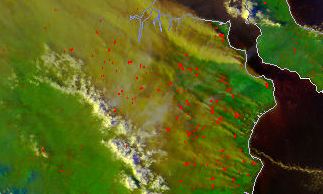
Using this combination, hotspots are depicted in red, smoke plumes and haze in shades of yellow, and clouds in either white or blue-white. The colour assignment is not unique and various colour-to-channel combinations can be used which will result in the different features to be highlighted in a different colour.
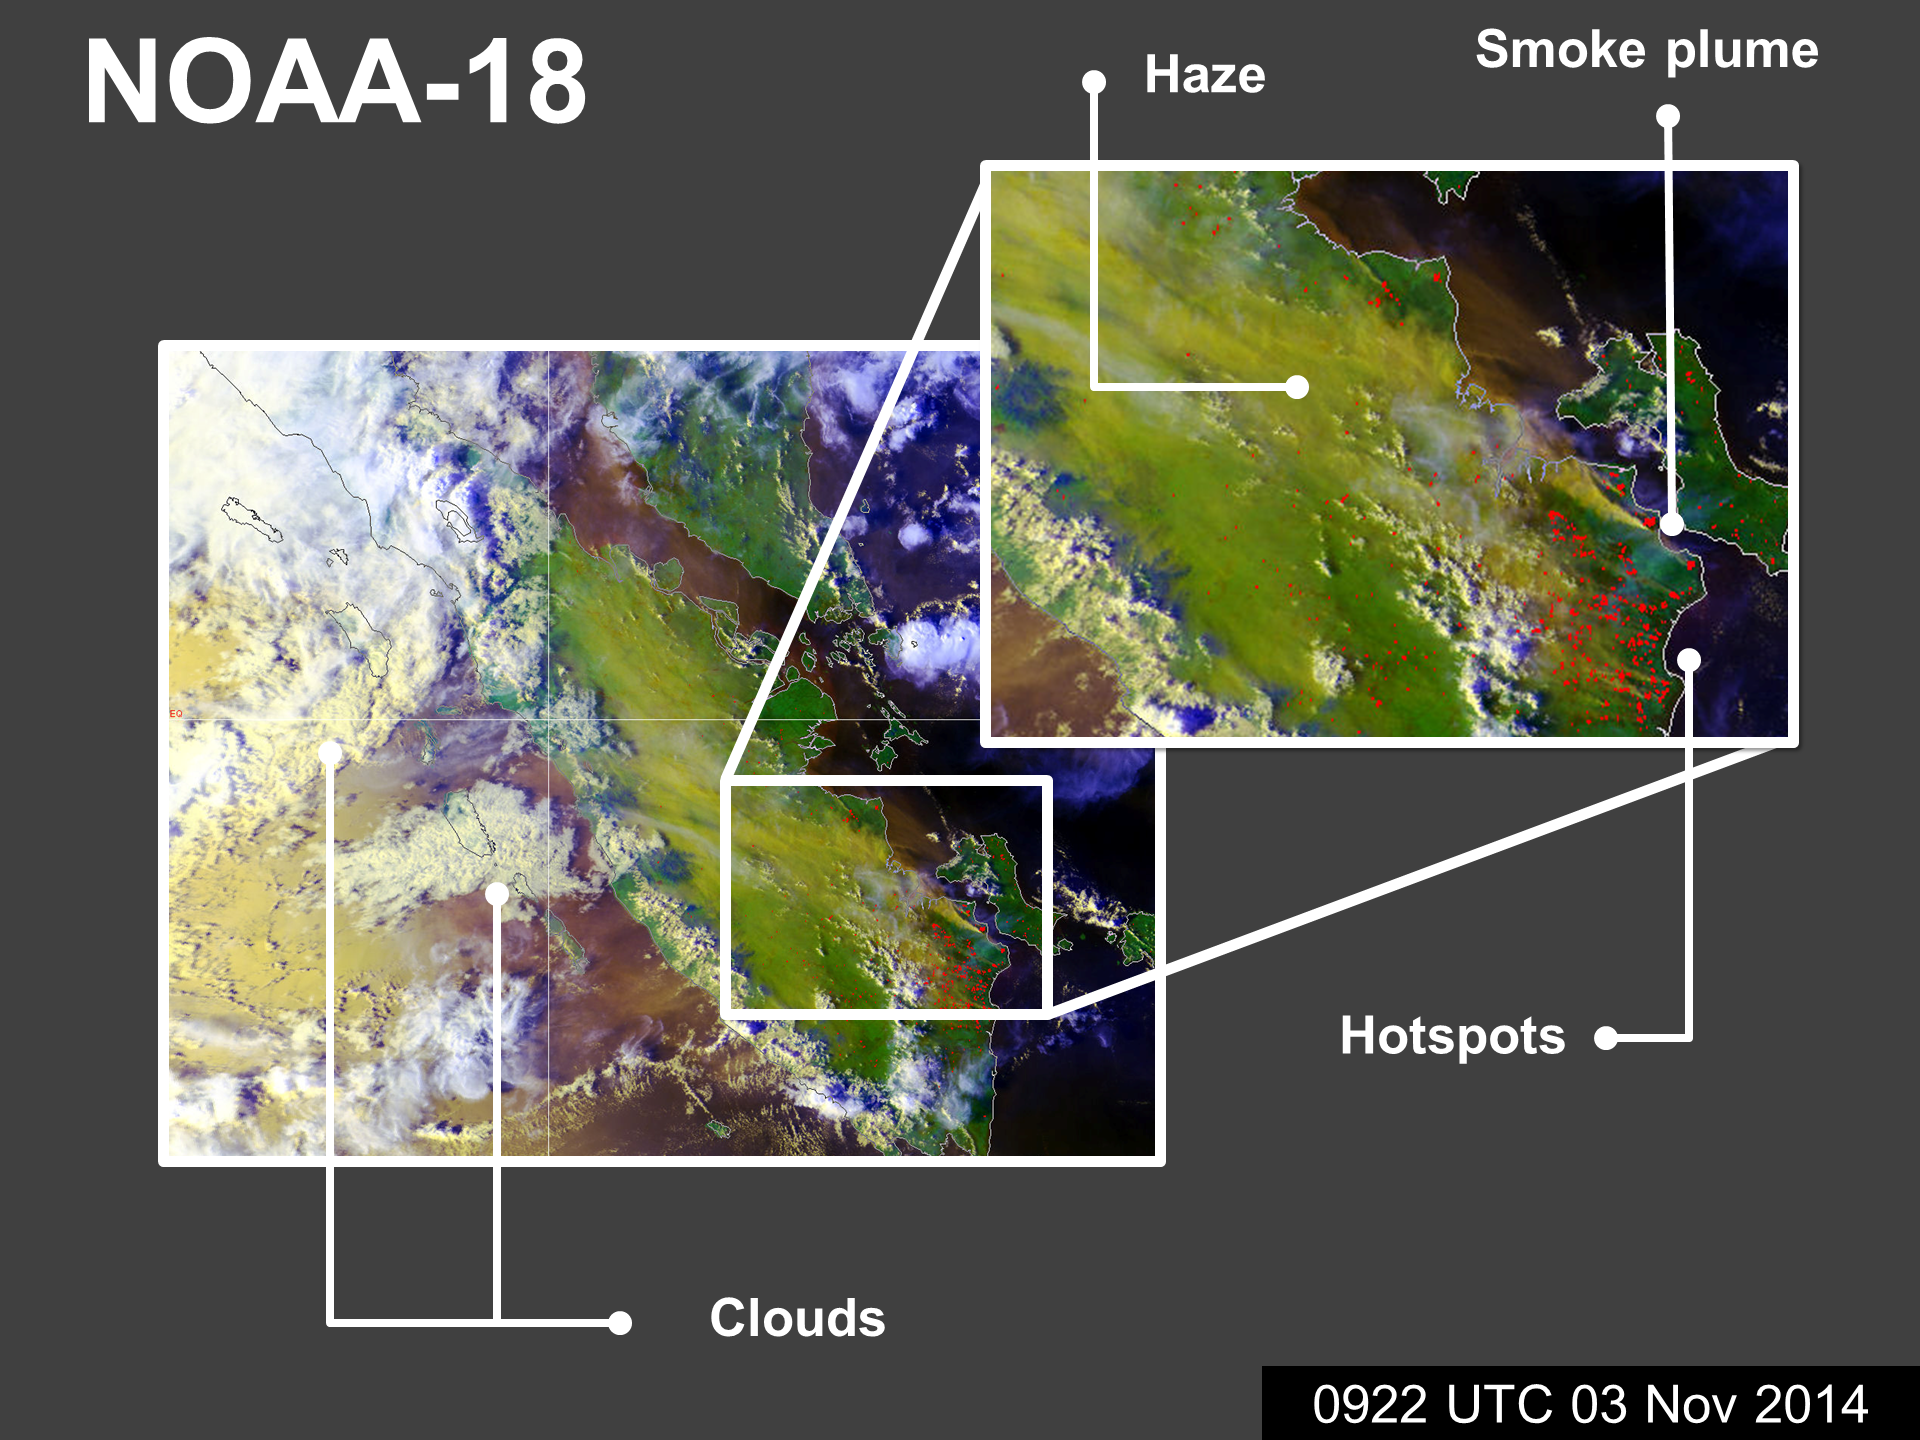
Land and vegetated surfaces are strongly reflective in the NIR (green) channel spectral band, thus appearing green in the above image. Clouds can be seen in both visible and LWIR spectral bands, whereas smoke haze is normally not discernable in the IR band owing to their respective radiative properties. Therefore clouds appear white or bluish-white as it is detected by all RGB channels; smoke haze and plumes appear in shades of yellow as it is detected by only visible (red) and NIR (green). The texture of clouds is also different from that of smoke haze.
If the hotspot appears at the origin of a smoke plume, it is almost certain to be associated with an active fire. The smoke plumes will show a conical shape typical of fire emissions, with the vertex over the hot spots. Hot spots with no corresponding smoke plumes may be associated with very small scale fires or fires at the early stages of ignition.
There are limitations to the detection of smoke haze and hotspots. Overlying clouds will invariably obscure areas with smoke haze and hotspots. In the presence of low clouds or fog, the smoke detection technique may not succeed and differences in the shape and texture between smoke and cloud/fog will need to be considered. Strong reflection of sunlight can also give rise to reddish shades over sea areas and these are not related to hotspots.
The El Niño phenomenon is a non-regular occurrence in the tropical pacific region where warmer waters develop over the Eastern Tropical Pacific Ocean along the coast of South America. In South East Asia, this brings drier weather and increases the risk of forest fires and smoke haze. The La Niña phenomenon is the reverse of the El Niño where cooler waters develop over the Eastern Tropical Pacific Ocean along the coast of South America. In South East Asia, higher than normal rainfall tends to occur during a La Niña episode which may result in an increased occurrence of floods.

Cross section of El Niño, neutral and La Niña conditions across the Tropical Pacific Ocean. (Image credit: NOAA)
The correlation between El Niño/La Niña and its associated weather impacts on South East Asia differ from one place to another and for different seasons.

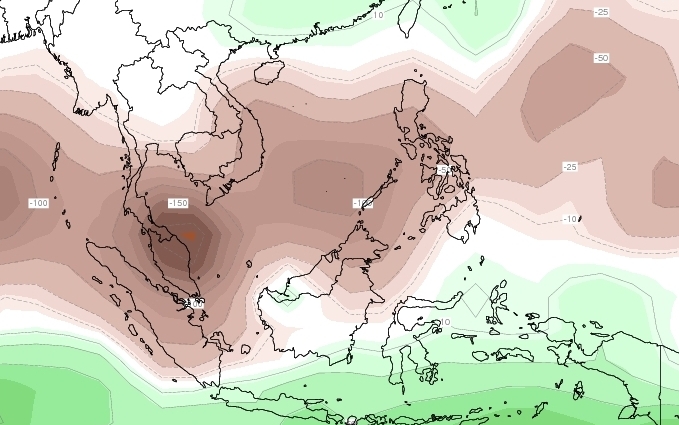
Distribution of precipitation anomalies over South East Asia (Jun – Oct) for El Niño (left) and La Niña (right) years. (Image credit: IRI Climate)
The image above shows the precipitation anomalies averaged over the El Niño and La Niña years. For instance, the impact of El Niño is typically stronger over the southern and eastern part of South East Asia during the months of Jun – Oct.
Browse The Following Topics For More Information