Review of Regional Weather for July 2025
1. Overview
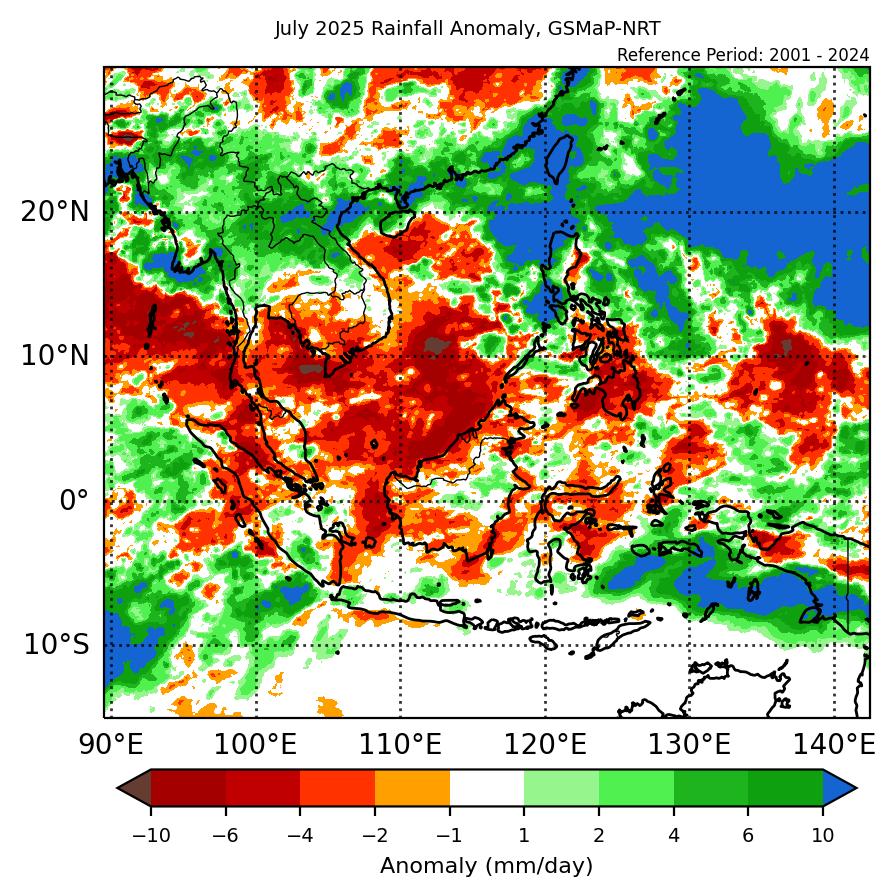
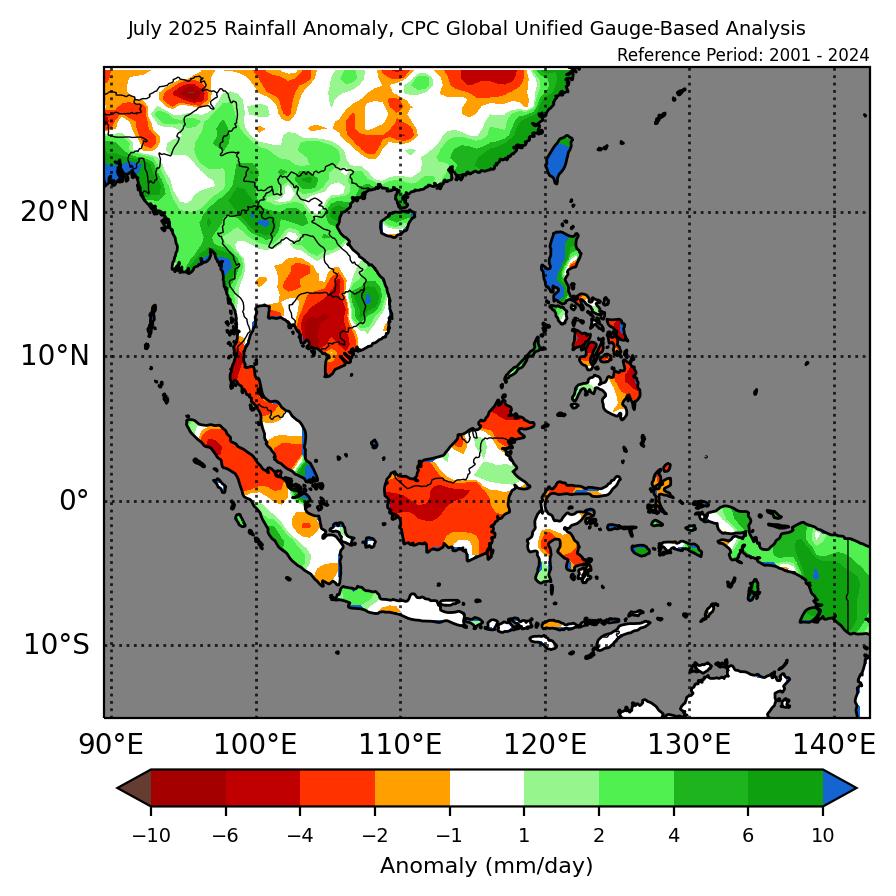
1.1 During July 2025, Southeast Asia experienced a mixed of below- to above-average rainfall, with the northwestern and parts of the central Maritime Continent as well as southern Mainland Southeast Asia experiencing below- to near-average rainfall while western and northern Mainland Southeast Asia and northern Philippines experienced above-average rainfall (Figure 1). The largest positive (wetter) anomalies were recorded over northern Philippines. However, there were some disagreements between GSMaP-NRT and CPC Unified Gauge datasets, with CPC Unified Gauge recording more intense below-average rainfall over Borneo and southern Mainland Southeast Asia.
1.2 The observed rainfall anomaly pattern of below-average rainfall over the Maritime Continent and southern Mainland Southeast Asia is mostly consistent with the predictions from the subseasonal weather outlooks for July 2025 (7 – 20 July 2025 and 21 July – 3 August 2025). The subseasonal weather outlooks also predicted the above-average rainfall over parts of Mainland Southeast Asia. The observations are also somewhat consistent with the seasonal outlook for July 2025, although the extent of the predicted region for below-normal rainfall is much smaller than the observed rainfall.
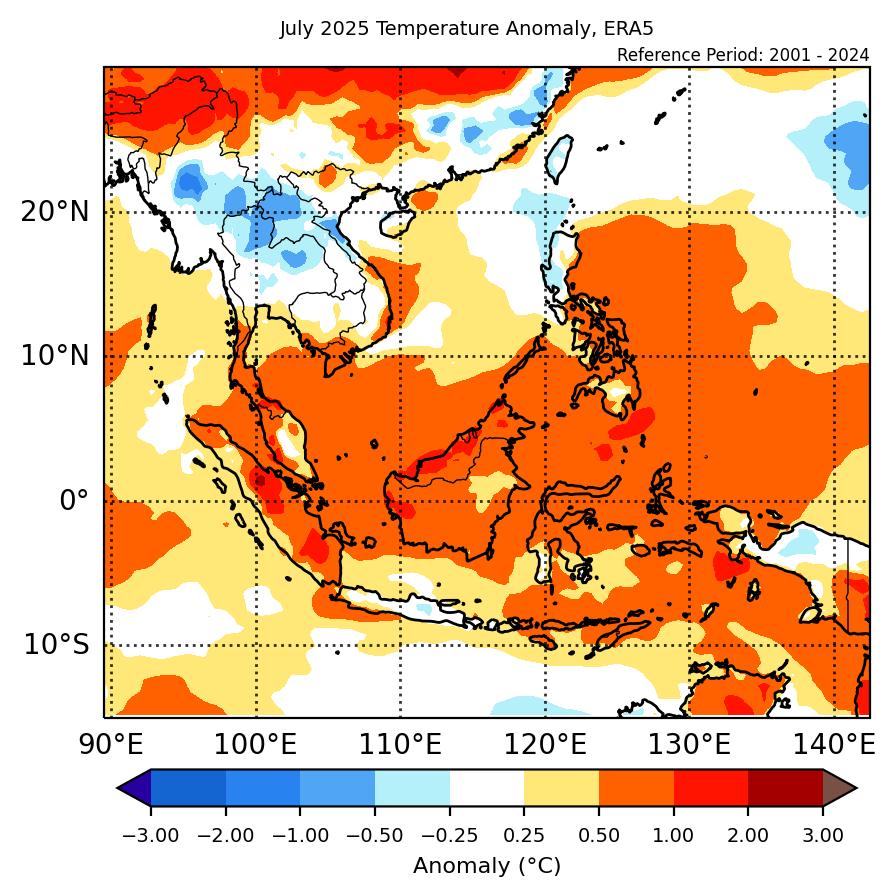
1.3 Below-average and near-average temperatures were recorded over much of northern Mainland Southeast Asia in July 2025, while above-average temperatures were recorded over most of the Maritime Continent and southern Mainland Southeast Asia (Figure 2). The coldest anomalies (-1°C – -2°C below average) were recorded over central Myanmar while the warmest anomalies (2°C – 3°C above average) were recorded over central Sumatra.
2. Climate Drivers
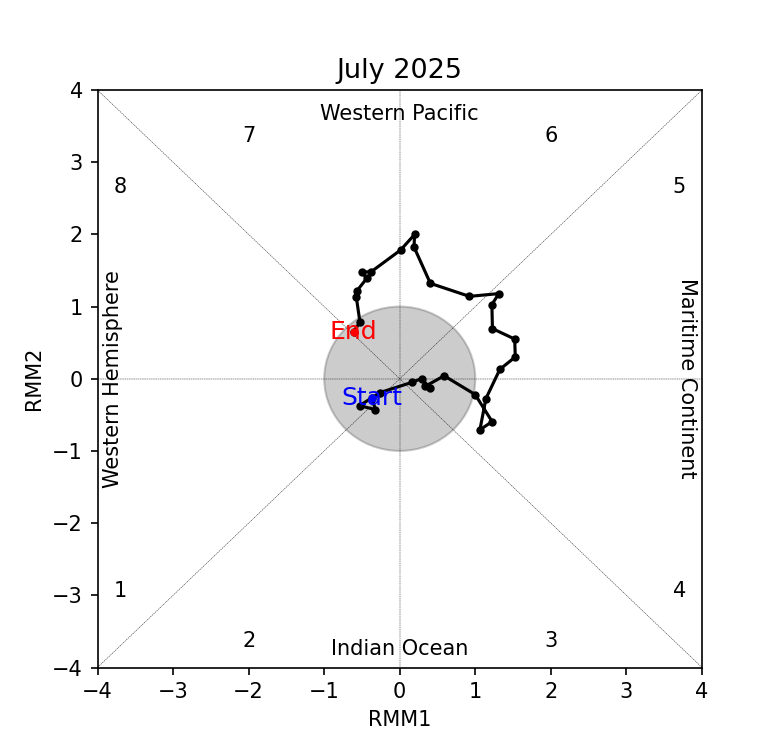
2.1 There was no discernible Madden-Julian Oscillation (MJO) signal at the start of July based on the RMM diagram (Figure 3). In the middle of Week 2, an MJO signal developed over the Maritime Continent (Phase 4) which then propagated eastwards to the Western Pacific (Phases 6 and 7) by the end of Week 3. The MJO signal continued to propagate through the Western Pacific before decaying at the end of the month. At this time of the year, Phases 4 and 5 tend to bring wetter conditions to parts of the Maritime Continent while Phase 7 tends to bring drier conditions.
2.2 ENSO-neutral conditions were present in July 2025.