Review of Regional Weather for March 2025
1. Overview
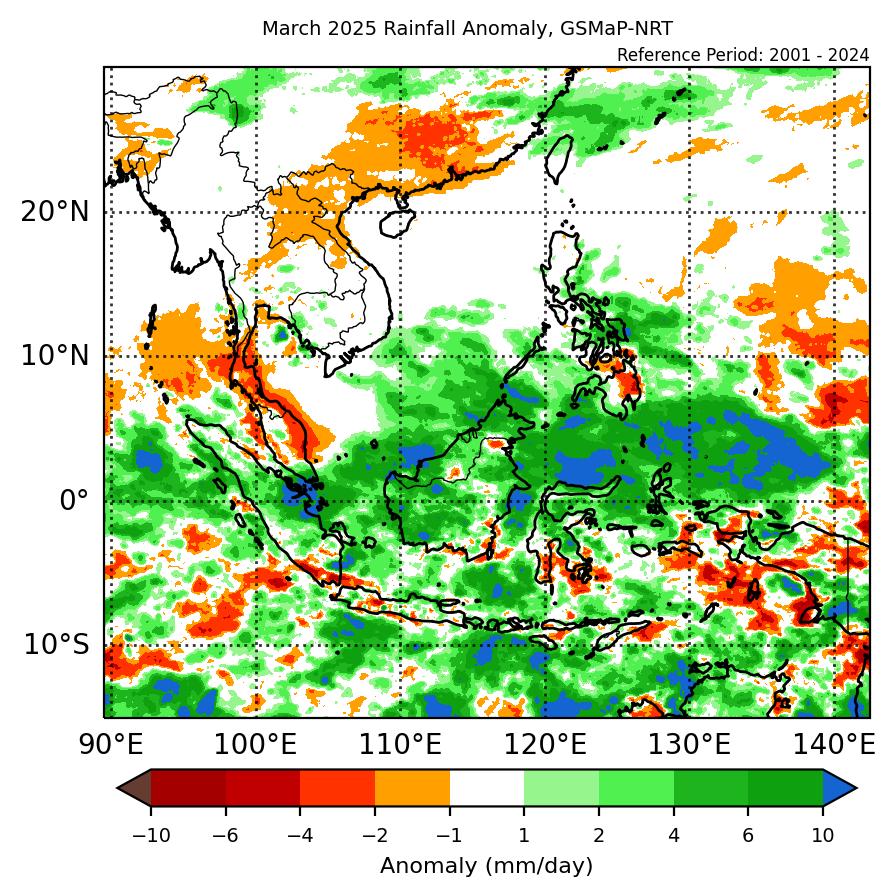
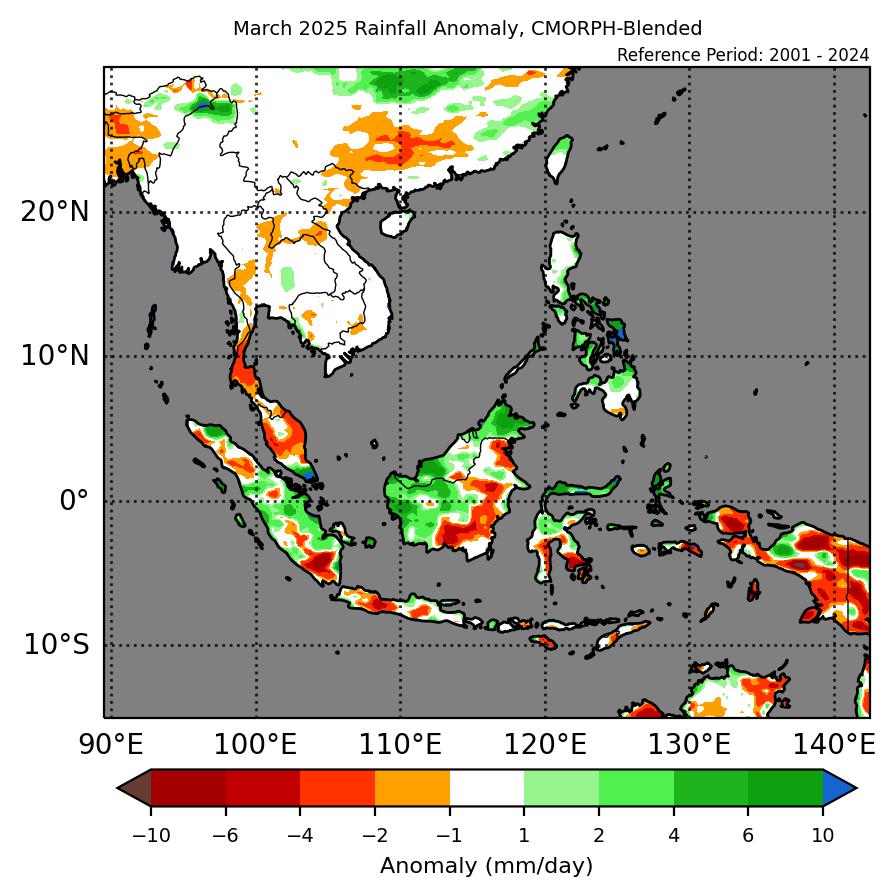
1.1 During March 2025, much of the Maritime Continent experienced above-average rainfall, except parts of the Philippines, the Malay Peninsula and the eastern Maritime Continent which experienced below-average rainfall (Figure 1). For Mainland Southeast Asia, below-average rainfall was recorded over parts of northeastern and southern region, with near average elsewhere. The largest positive (wetter) anomalies were recorded around the eastern coast of Sumatra to the southern tip of Malay Peninsula, while the largest negative (drier) anomalies were recorded over the northwestern Maritime Continent. There were disagreements between GSMaP-NRT and CMORPH-Blended datasets on the extent and magnitude of the dry anomalies, in particular over northern Lao PDR, northern Vietnam, parts of southern Philippines, southern Sumatra, Java and southeast Borneo, and Papua, with CMORPH-Blended showing stronger and more extensive dry anomalies as compared to GSMaP-NRT.
1.2 The observed rainfall anomaly pattern of above-average rainfall over much of the Maritime Continent is consistent with the predictions from the subseasonal weather outlooks for March 2025 (3 – 16 March 2025, and 17 – 30 March 2025). The observed pattern of above-average rainfall over the Maritime Continent is also consistent with the March 2025 seasonal outlook, although the below-normal rainfall over parts of the Maritime Continent is not well represented.
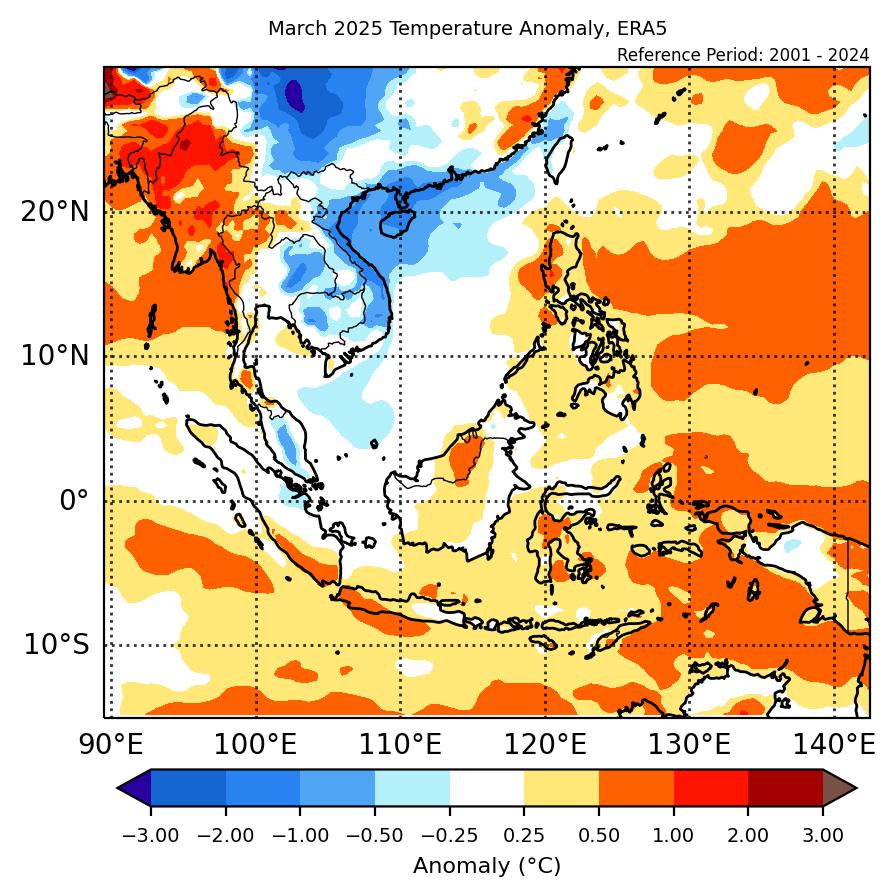
1.3 A mix of normal and below-average temperatures were recorded over eastern half of Mainland Southeast Asia whereas above-average temperatures were recorded over the western half of Mainland Southeast Asia in March 2025 (Figure 2). Elsewhere, above-average temperature were recorded over much of the Maritime Continent, except over the northwestern region with below- to near-average temperature. The coldest anomalies (-1°C – -2°C below average) were recorded over parts of central Vietnam and northeastern Thailand, while the warmest anomalies (1°C – 2°C above average) were recorded over western Myanmar.
2. Climate Drivers
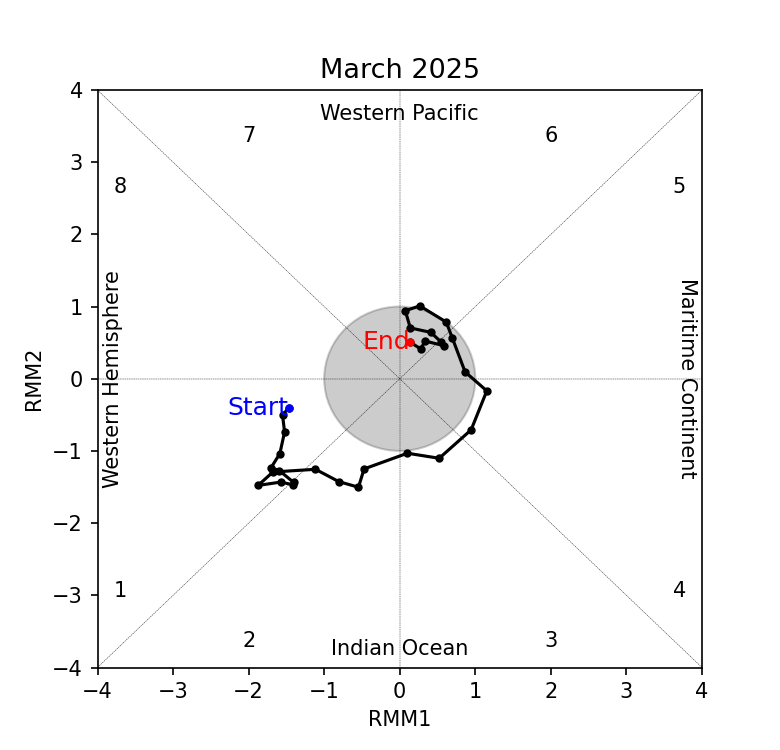
2.1 In the first week of March, an active Madden-Julian Oscillation (MJO) signal was observed over the Western Hemisphere (Phase 1). In the second week of the month, the signal propagated eastwards through the Indian Ocean (Phases 2 and 3) and continued its eastwards propagation over the Maritime Continent (Phase 4) in the third week. The signal weakened towards the end of third week of March over the Maritime Continent and became indiscernible in the last week of the month. During this time of the year, Phase 1 typically bring drier conditions to the Maritime Continent. Phase 2 and 3 tend to bring wetter conditions over the western Maritime Continent, while Phases 4 and 5 typically bring wetter conditions over much of the Maritime Continent. This observed MJO signal during March is in line with the above-normal rainfall anomalies in Figure 1.
2.2 In March 2025, La Niña conditions were present. Sea surface temperatures in the Nino3.4 region (used to monitor ENSO) indicated La Niña conditions and atmospheric indicators (cloudiness and trade winds) also showed signs of La Niña. La Niña events tend to bring wetter-than-average conditions to much of the Maritime Continent during this time of the year.