Monthly Archives: February 2025

February 26, 2025

Subseasonal Weather Outlook (3 – 16 March 2025)

Subseasonal Weather Outlook (3 – 16 March 2025)

Issued: 26 February 2025
First forecast week: 3 March – 9 March 2025
Second forecast week: 10 March – 16 March 2025

figure1

Figure 1: Rainfall Outlook

figure2

Figure 2: Temperature Outlook

Wetter conditions are predicted over much of the Maritime Continent (except for the southern and southeastern parts) and southeastern Mainland Southeast Asia in the next fortnight (3 – 16 March).

No significant regional temperature anomalies are predicted in the next fortnight (3 – 16 March).

A weak Madden-Julian Oscillation (MJO) signal was present over the Western Hemisphere and Africa (Phases 8 and 1) towards the end of February, based on the RMM Index. Most models do not indicate coherent MJO activity during the forecast period. However, some models predict an MJO signal to briefly propagate over the Indian Ocean (Phases 2 and 3) before decaying in Week 1 (3 – 9 March).

The outlook is assessed for the region in general, where conditions are relative to the average conditions for the corresponding time of year. For specific updates on the national scale, the relevant ASEAN National Meteorological and Hydrological Services should be consulted.

February 18, 2025

Review of Regional Weather for January 2025

Review of Regional Weather for January 2025


1. Overview

1.1 During January 2025, much of the Maritime Continent experienced above-average rainfall, with only parts of southern Philippines and the Malay Peninsula experiencing below-average rainfall (Figure 1). Over Mainland Southeast Asia, there were no notable anomalies, typical of the dry season for this region. The largest positive (wetter) anomalies were recorded over the southern tip of Malay Peninsula, eastern coast of Sumatra, and northwest Borneo, while the largest negative (drier) anomalies were recorded over southern Philippines. There were disagreements between GSMaP-NRT and CMORPH-Blended datasets on the extent and magnitude of the dry anomalies over southern Philippines, with GSMaP-NRT showing stronger and more extensive dry anomalies as compared to CMORPH-Blended. More disagreements between the datasets are also evident over Sumatra and western Papua, with CMORPH-Blended tending to show drier conditions over these regions as compared to GSMaP-NRT.

1.2 The observed rainfall anomaly pattern of above-average rainfall over much of the Maritime Continent is consistent with the predictions from the subseasonal weather outlooks for January 2025 (6 – 19 January 2025, and 20 January – 2 February 2025). The observed pattern is also consistent with the January 2025 seasonal outlook of above-normal rainfall over parts of the Maritime Continent.

era5_rainfall_anomalies
cmorph_bld_rainfall_anomalies
Figure 1: Rainfall anomalies for January 2025 based on GSMaP-NRT data (left) and CMORPH-Blended data (right). The climatological reference period is 2001-2023. Green colour denotes above-average rainfall (wetter), while orange denotes below-average rainfall (drier).


1.3 Below-average temperatures were recorded over much of Mainland Southeast Asia in January 2025 (Figure 2). Elsewhere, positive temperature anomalies were recorded over parts of Myanmar and the eastern and northeastern Maritime Continent. The coldest anomalies (-2°C – -3°C below average) were recorded over parts of northeastern Thailand and northern Cambodia, while the warmest anomalies (1°C – 2°C above average) were recorded over northwestern Myanmar.

era5_temperature_anomalies
Figure 2: Temperature anomalies for January 2025 based on ERA-5 reanalysis. The climatological reference period is 2001-2023. Red colour denotes above-average temperature (warmer), while blue denotes below-average temperature (colder).


2. Climate Drivers

2.1 In the first week of the January, no active Madden-Julian Oscillation (MJO) signal was observed. During the second week of the month, an active MJO signal emerged, and was present over the Western Hemisphere (Phases 8 and 1). Then, the signal propagated eastwards through the Indian Ocean (Phases 2 and 3) in the third week of January and continued its eastwards propagation over the Maritime Continent (Phases 4 and 5) in the last week of the month. During this time of the year, Phases 8 and 1 typically bring drier conditions to the Maritime Continent. Phase 2 and 3 and tend to induce wetter conditions over the western Maritime Continent, while Phases 4 and 5 typically bring wetter conditions over much of the Maritime Continent. This observed MJO signal during January is in line with the above-normal rainfall anomalies in Figure 1.

mjo_phase_diagram


Figure 3: The MJO phase diagram. The diagram illustrates the movement of the MJO through different phases, which correspond to different locations along the equator (denoted in the text with the first day of the month in blue and the last day of the month in red). The distance of the index from the centre of the diagram is related to the strength of the MJO. Values within the grey circle are considered weak or indiscernible (data from the Bureau of Meteorology, Australia).


2.2 In January 2025, La Niña conditions were present. Sea surface temperatures in the Nino3.4 region (used to monitor ENSO) indicated La Niña conditions and atmospheric indicators (cloudiness and trade winds) also showed signs of La Niña. La Niña events tend to bring wetter-than-average conditions to much of the Maritime Continent during this time of the year.


February 12, 2025

Subseasonal Weather Outlook (17 February – 2 March 2025)

Subseasonal Weather Outlook (17 February – 2 March 2025)

Issued: 12 February 2025
First forecast week: 17 – 23 February 2025
Second forecast week: 24 February – 2 March 2025

figure1

Figure 1: Rainfall Outlook

figure2

Figure 2: Temperature Outlook

Wetter conditions are predicted over much of the Maritime Continent in the next fortnight (17 February – 2 March).

No significant regional temperature anomalies are predicted in the next fortnight (17 February – 2 March).

A Madden-Julian Oscillation (MJO) signal was present over the Western Pacific (Phases 6 and 7) in the second week of February. Models predict this MJO signal to propagate eastwards, reaching the Western Hemisphere and Africa (Phase 8) by the start of the forecast period. Most models predict the MJO to remain in Phase 8 throughout Week 1 (17 – 23 February), with some models indicating a weakening of the signal in Week 2 (24 February – 2 March).

The outlook is assessed for the region in general, where conditions are relative to the average conditions for the corresponding time of year. For specific updates on the national scale, the relevant ASEAN National Meteorological and Hydrological Services should be consulted.

February 6, 2025

Review of Regional Haze Situation for January 2025

Review of Regional Haze Situation for January 2025

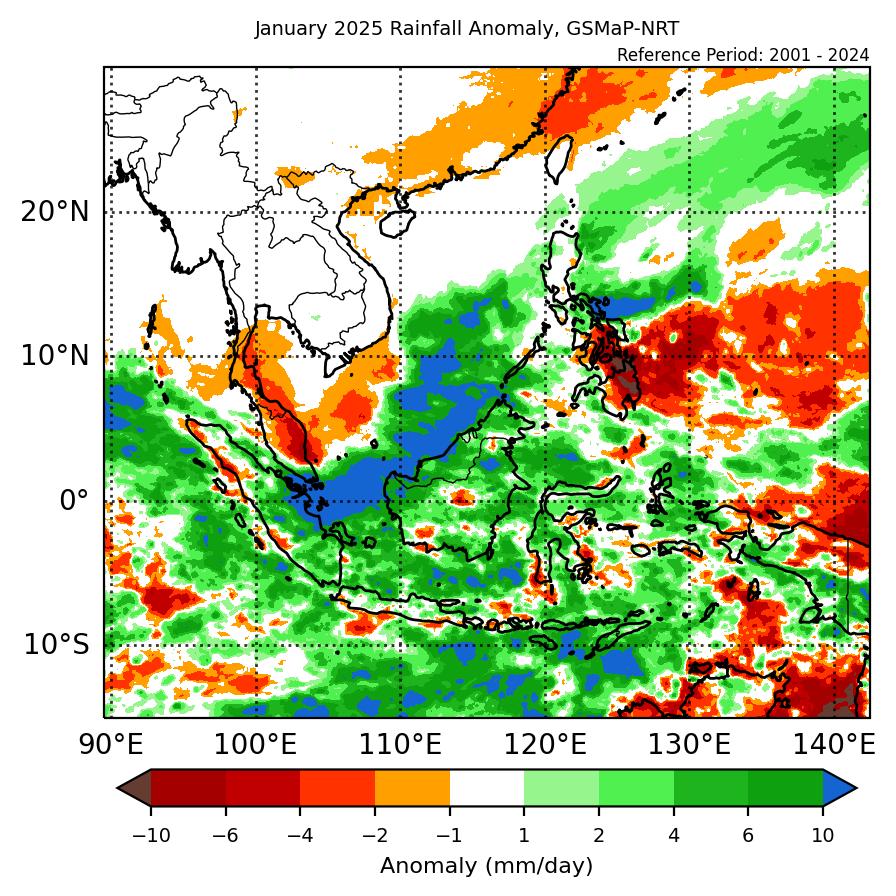
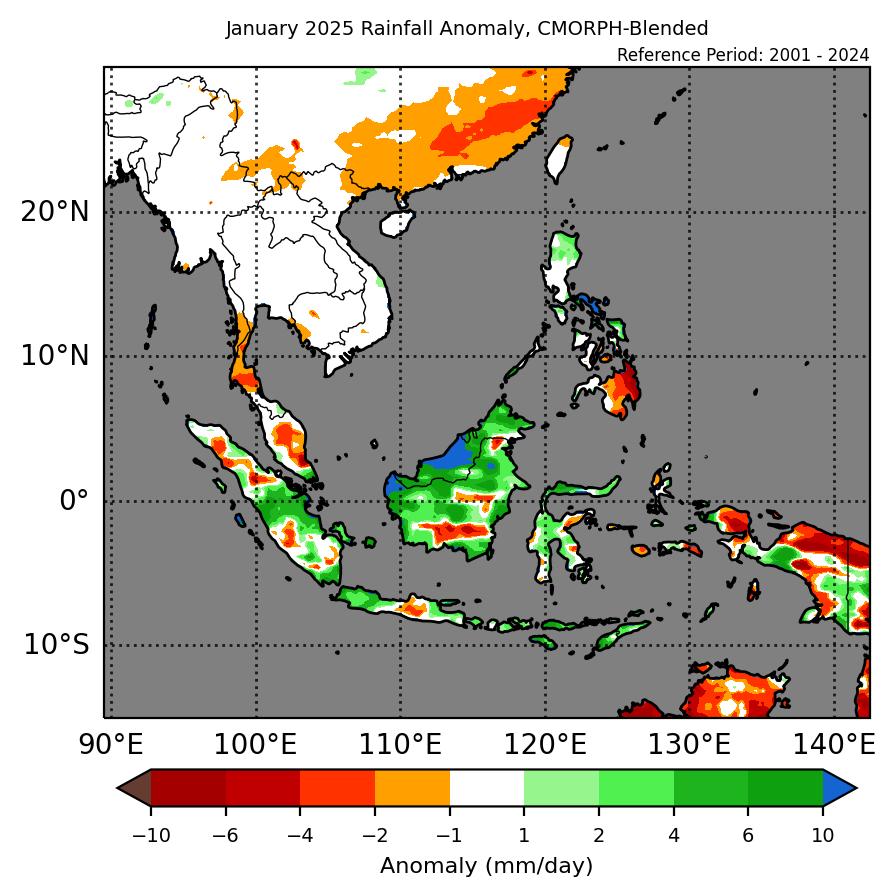
1.1 Northeast Monsoon conditions persisted over the ASEAN region in January 2025. During this month, the prevailing low-level winds over regions north of the Equator blew mostly from the northeast or east, except over the northern parts of the Mekong sub-region, where the winds were light and variable in direction. Meanwhile, the prevailing low-level winds over regions south of the Equator blew mainly from the west or northwest (Figure 1).

1.2 As the dry conditions persisted with a gradually increasing number of hotspots since December 2024, Alert Level 1 for the onset of the dry season for the northern ASEAN region was issued on 2 January 2025. Thereafter, under the persisting dry conditions, the hotspot and smoke haze situation over the Mekong sub-region escalated with a heightened risk of transboundary smoke haze occurrence, and Alert Level 2 for the Mekong sub-region was activated on 20 January 2025. Showers were observed elsewhere in the ASEAN region, except for parts of the northern Philippines where there were brief periods of drier weather (Figure 1).

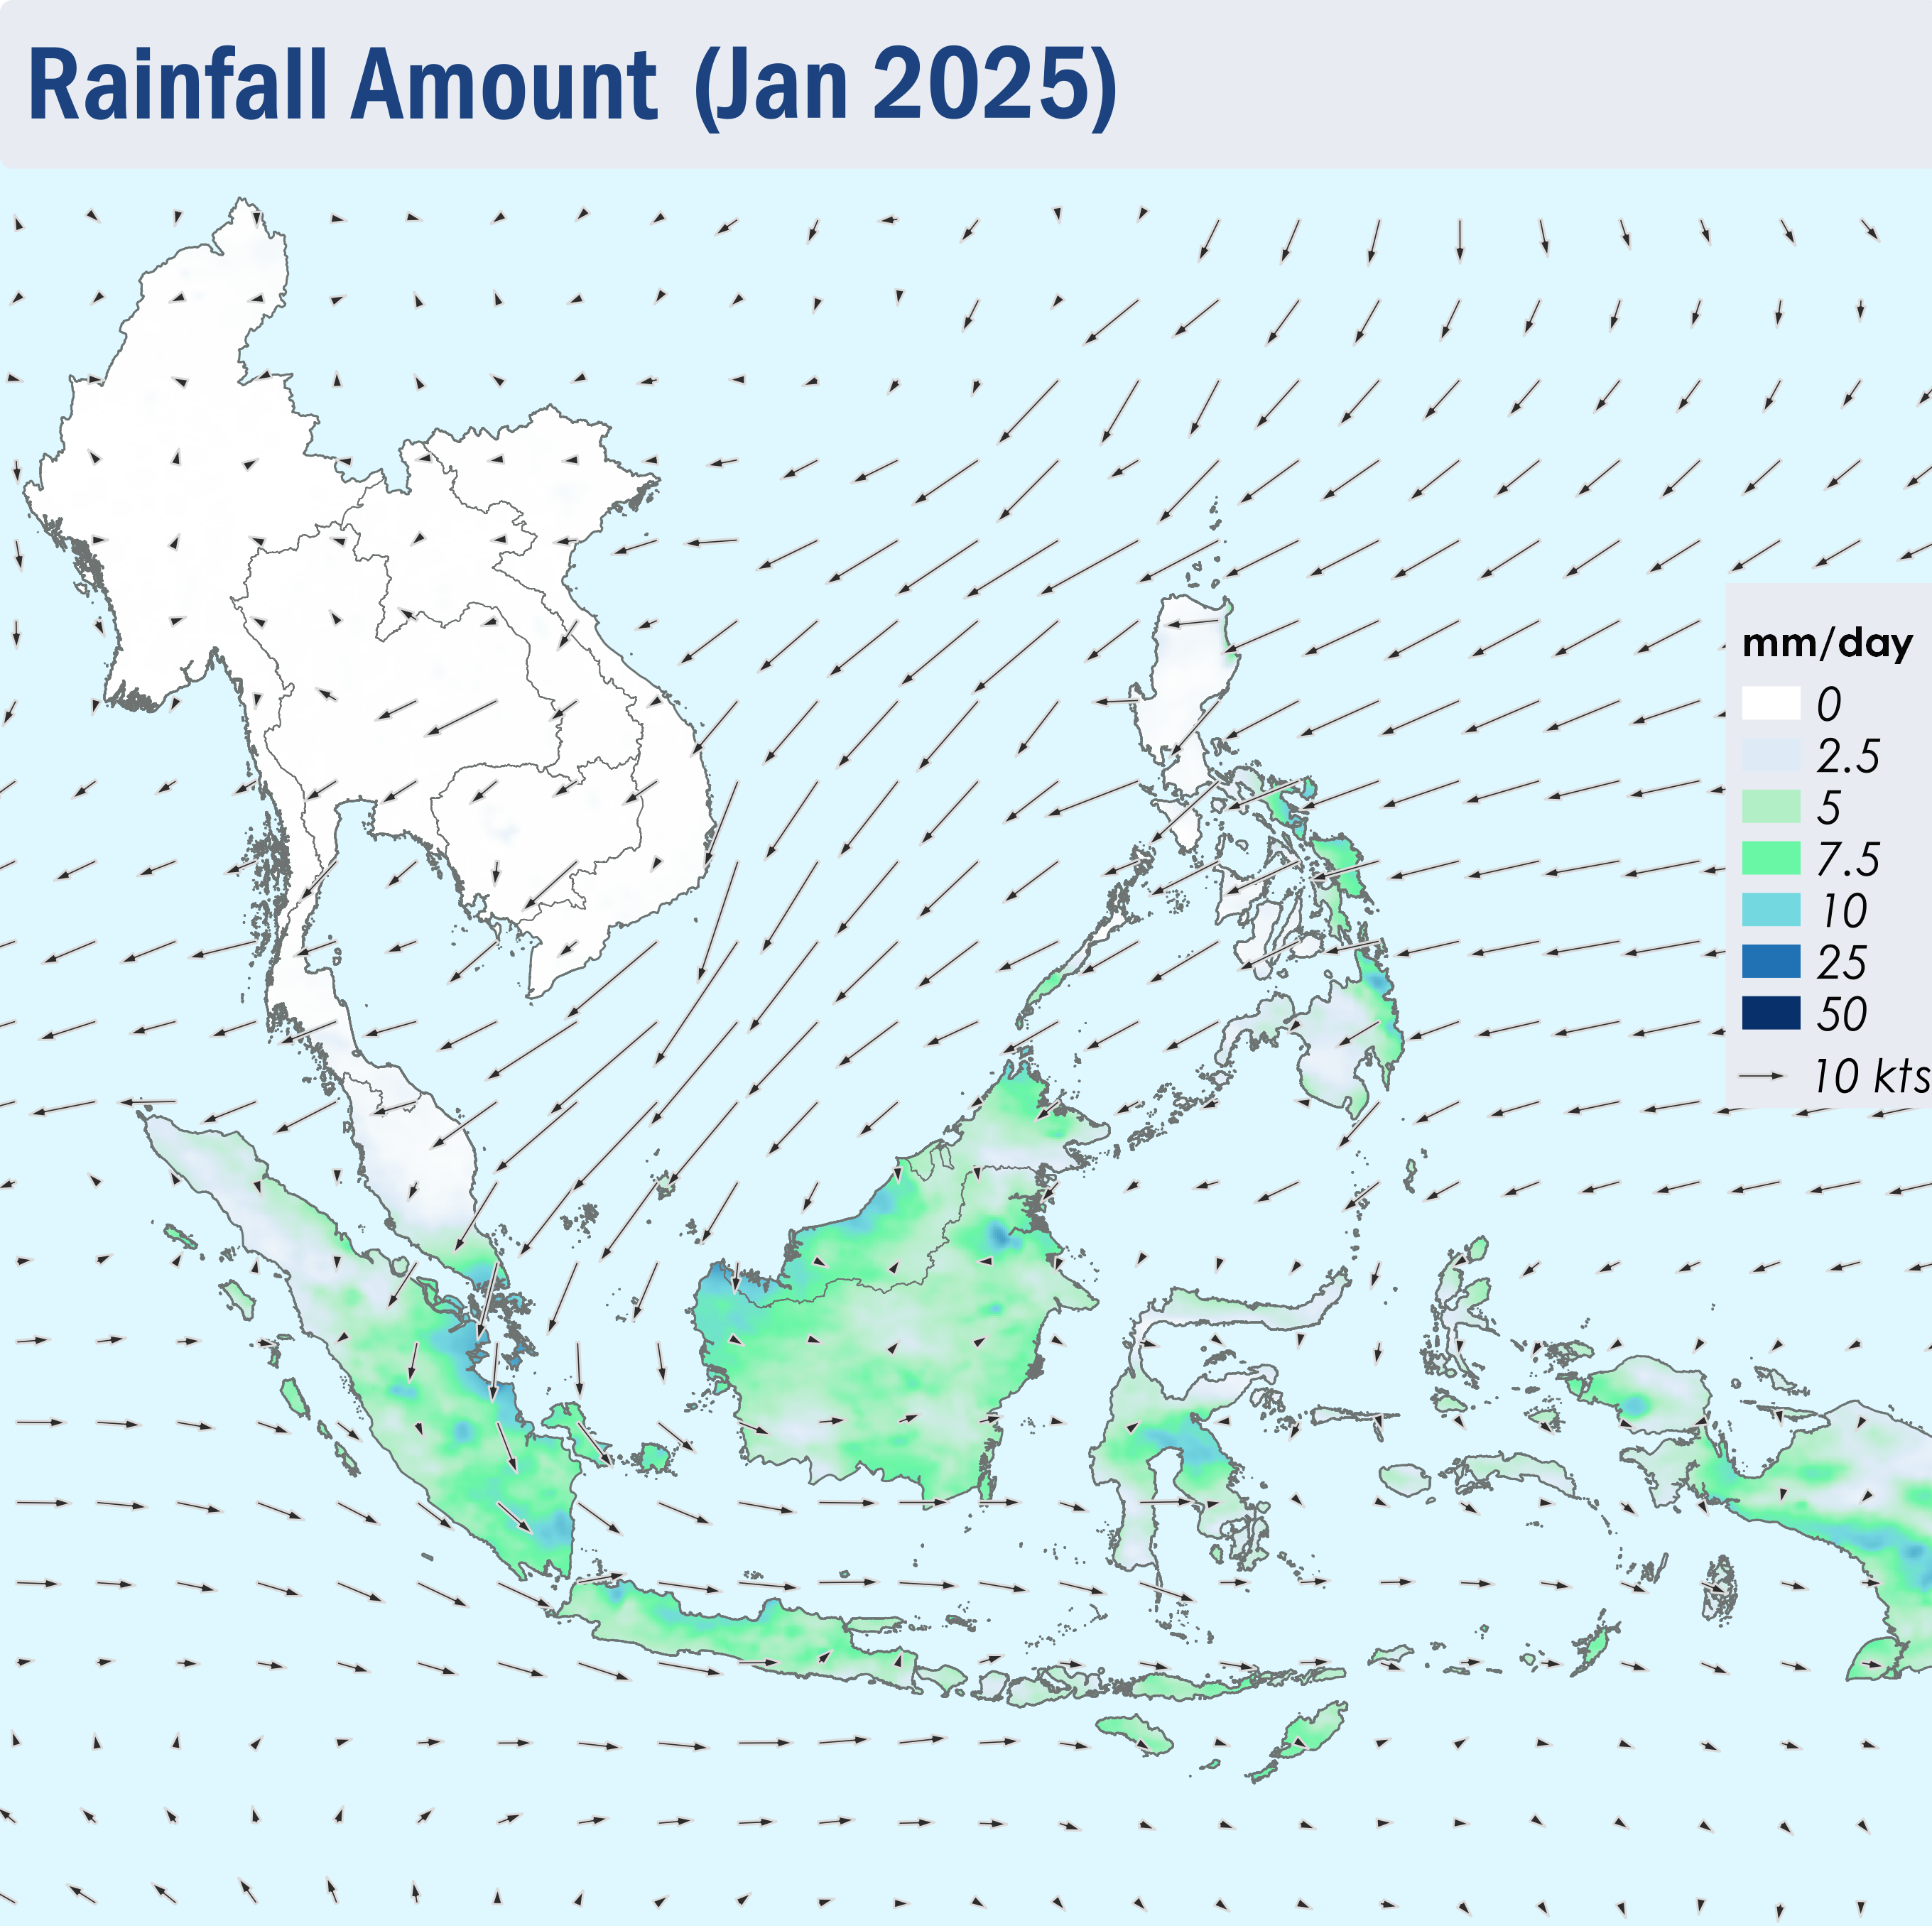
Figure 1: Average Daily Rainfall and Mean Winds for January 2025. (Source: JAXA GsMaP and GFS, respectively)


1.3 The overall hotspot counts for the ASEAN region in January 2025 were generally lower than or comparable to hotspot counts recorded for the same period in previous years (Figures 2 and 3).


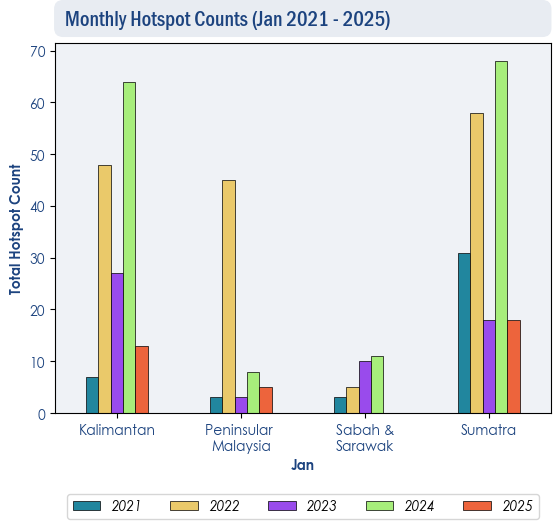
Figure 2: Hotspot counts for the southern ASEAN region for January (2021-2025) based on NOAA-20 satellite surveillance.


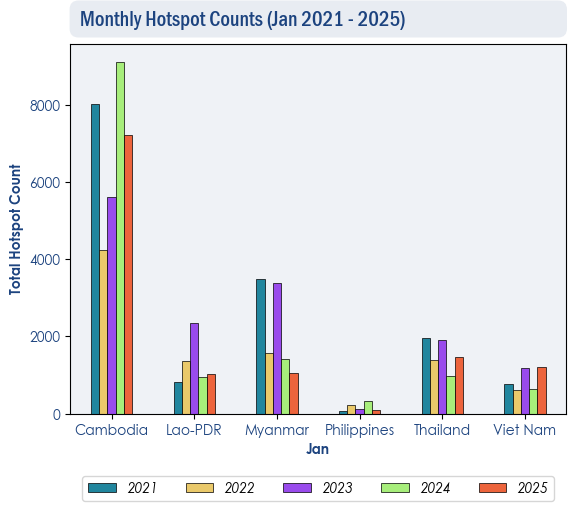
Figure 3: Hotspot counts for the northern ASEAN region for January (2021-2025) based on NOAA-20 satellite surveillance.


1.4 Isolated to scattered hotspots were detected in the Mekong sub-region (Figure 4) and the Philippines. Persistent clusters of hotspots, some of which were intense, with moderate to dense smoke plumes were observed consistently in many parts of Cambodia and central Thailand (Figures 4, 6, 7, 8 and 9). Moderate smoke haze was also observed in the northern parts of Thailand, most of Myanmar, as well as the northern and southern parts of Lao PDR (Figures 6, 7 and 8). Towards the end of the month, smoke haze emanating from hotspots detected in the western parts of Cambodia was observed drifting westwards into the central parts of Thailand.


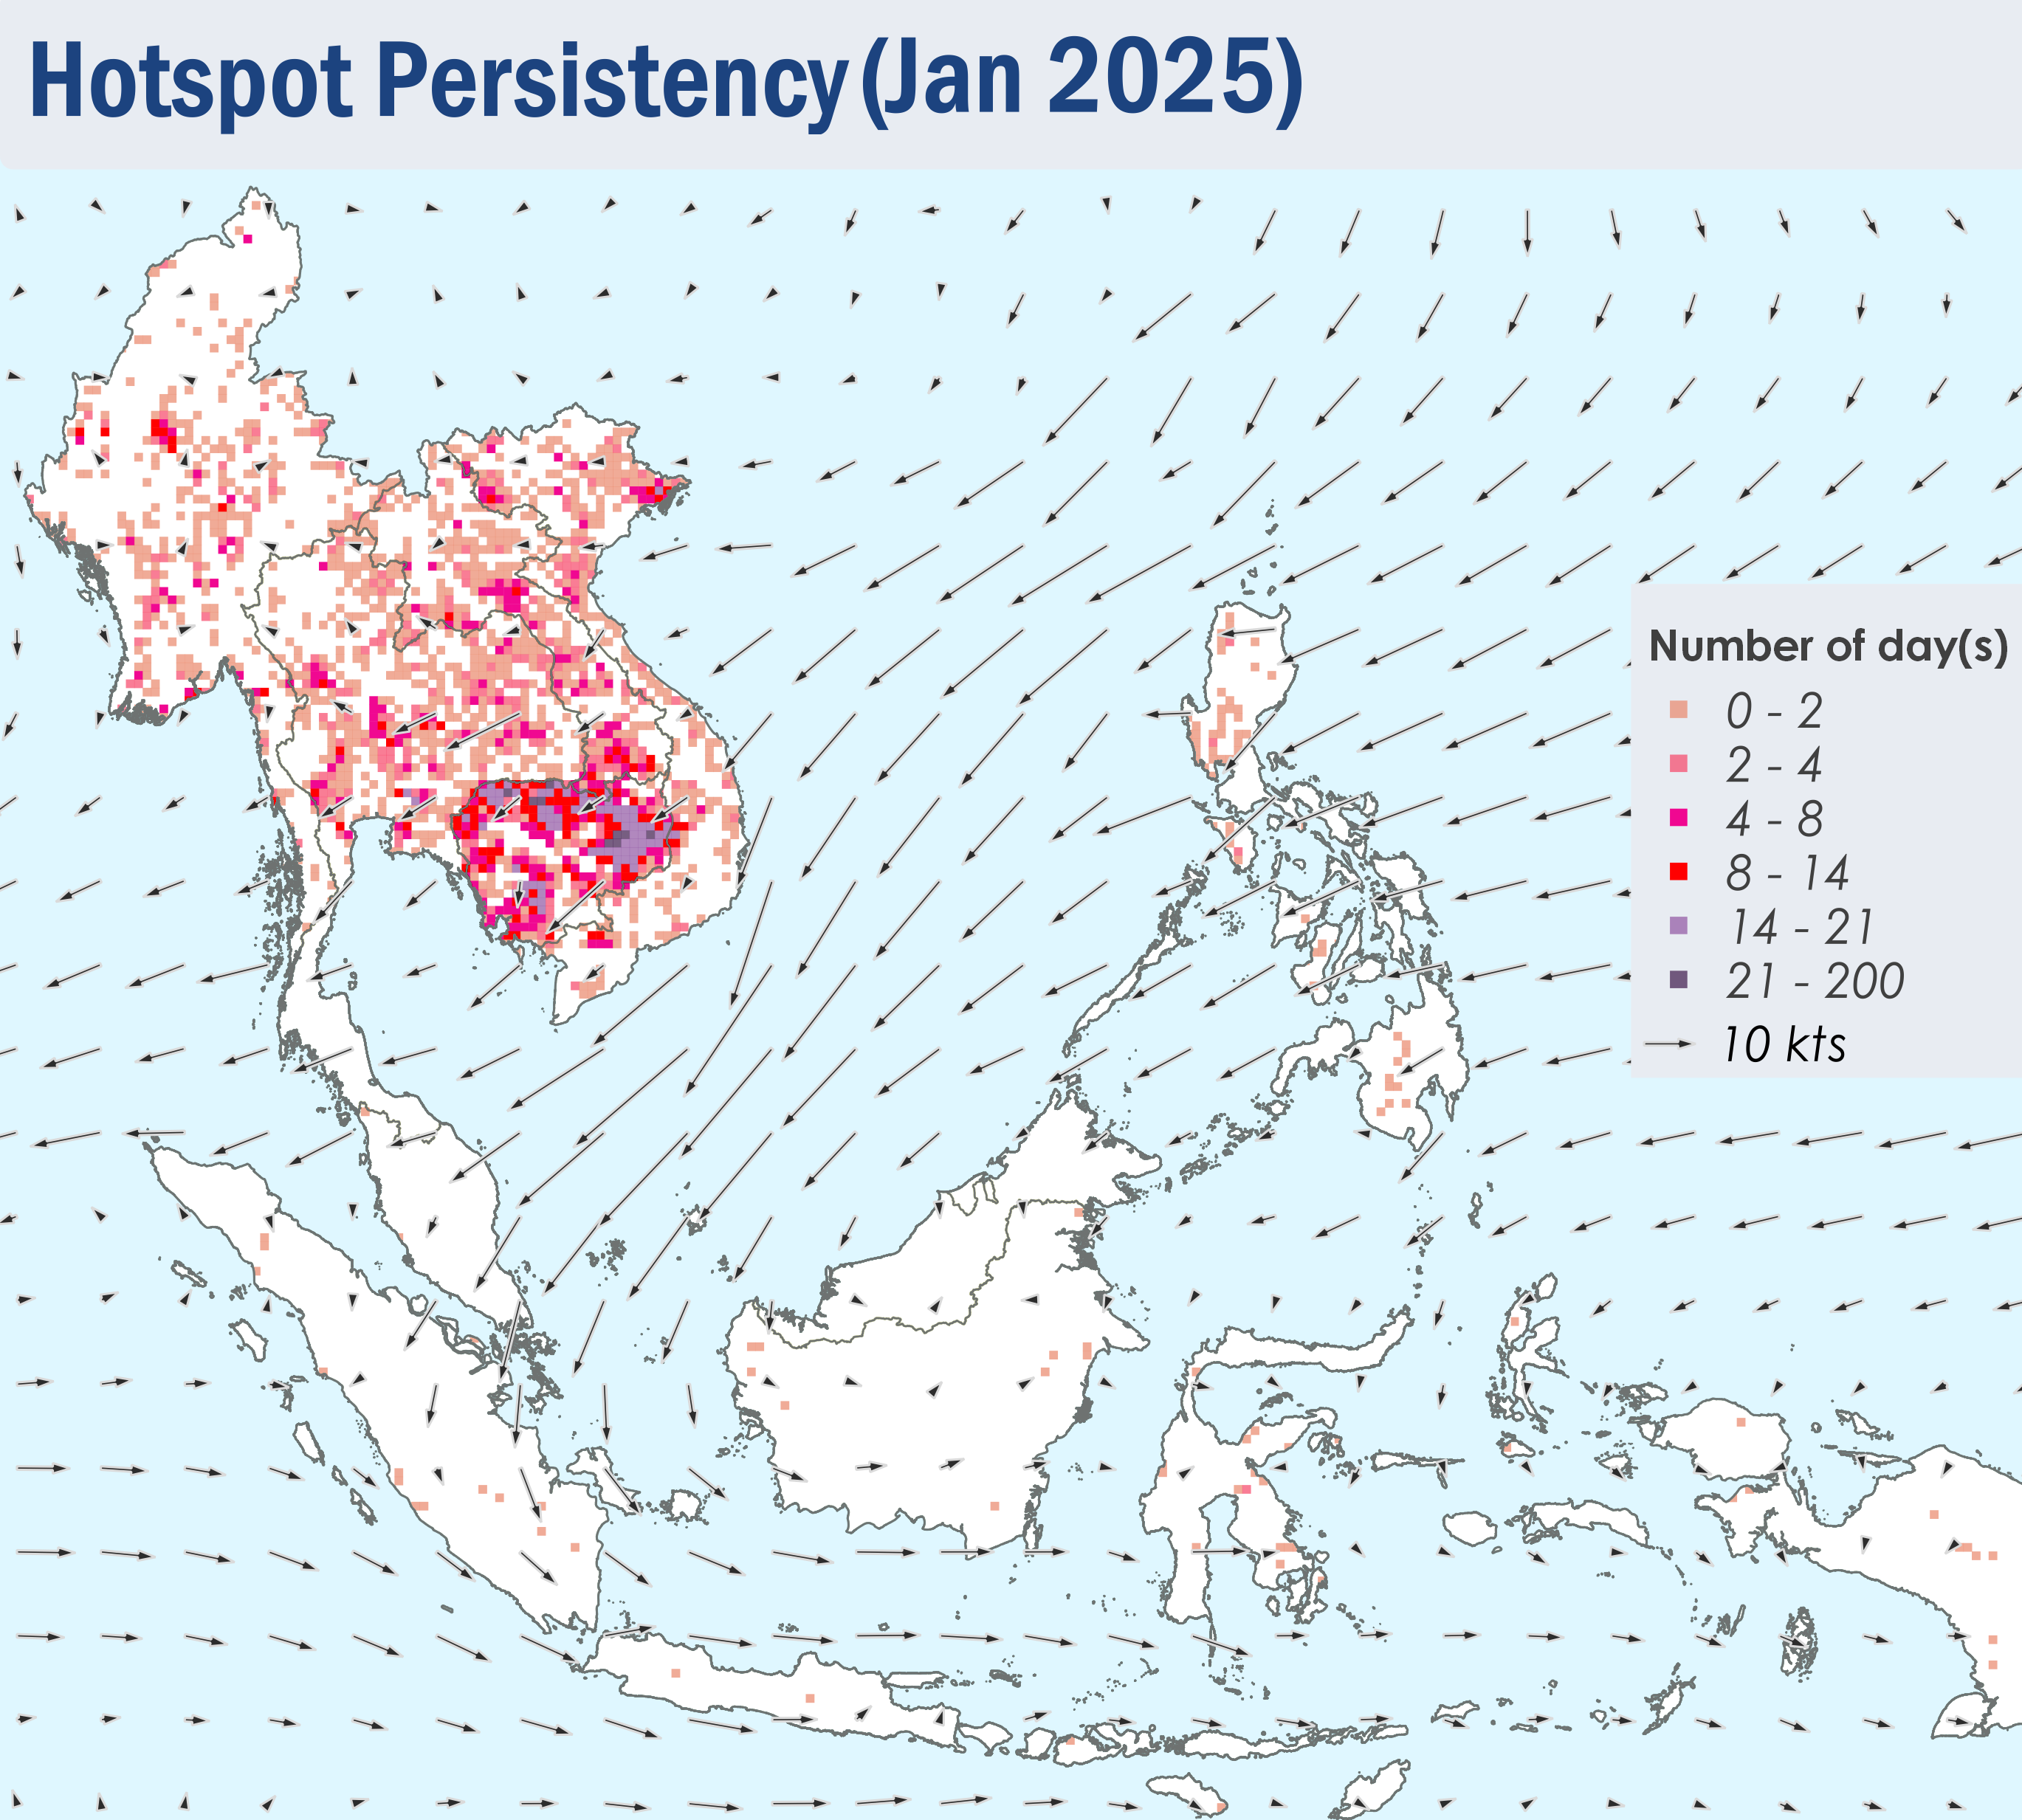
Figure 4: Distribution of hotspots detected in January 2025 based on NOAA-20 satellite surveillance.


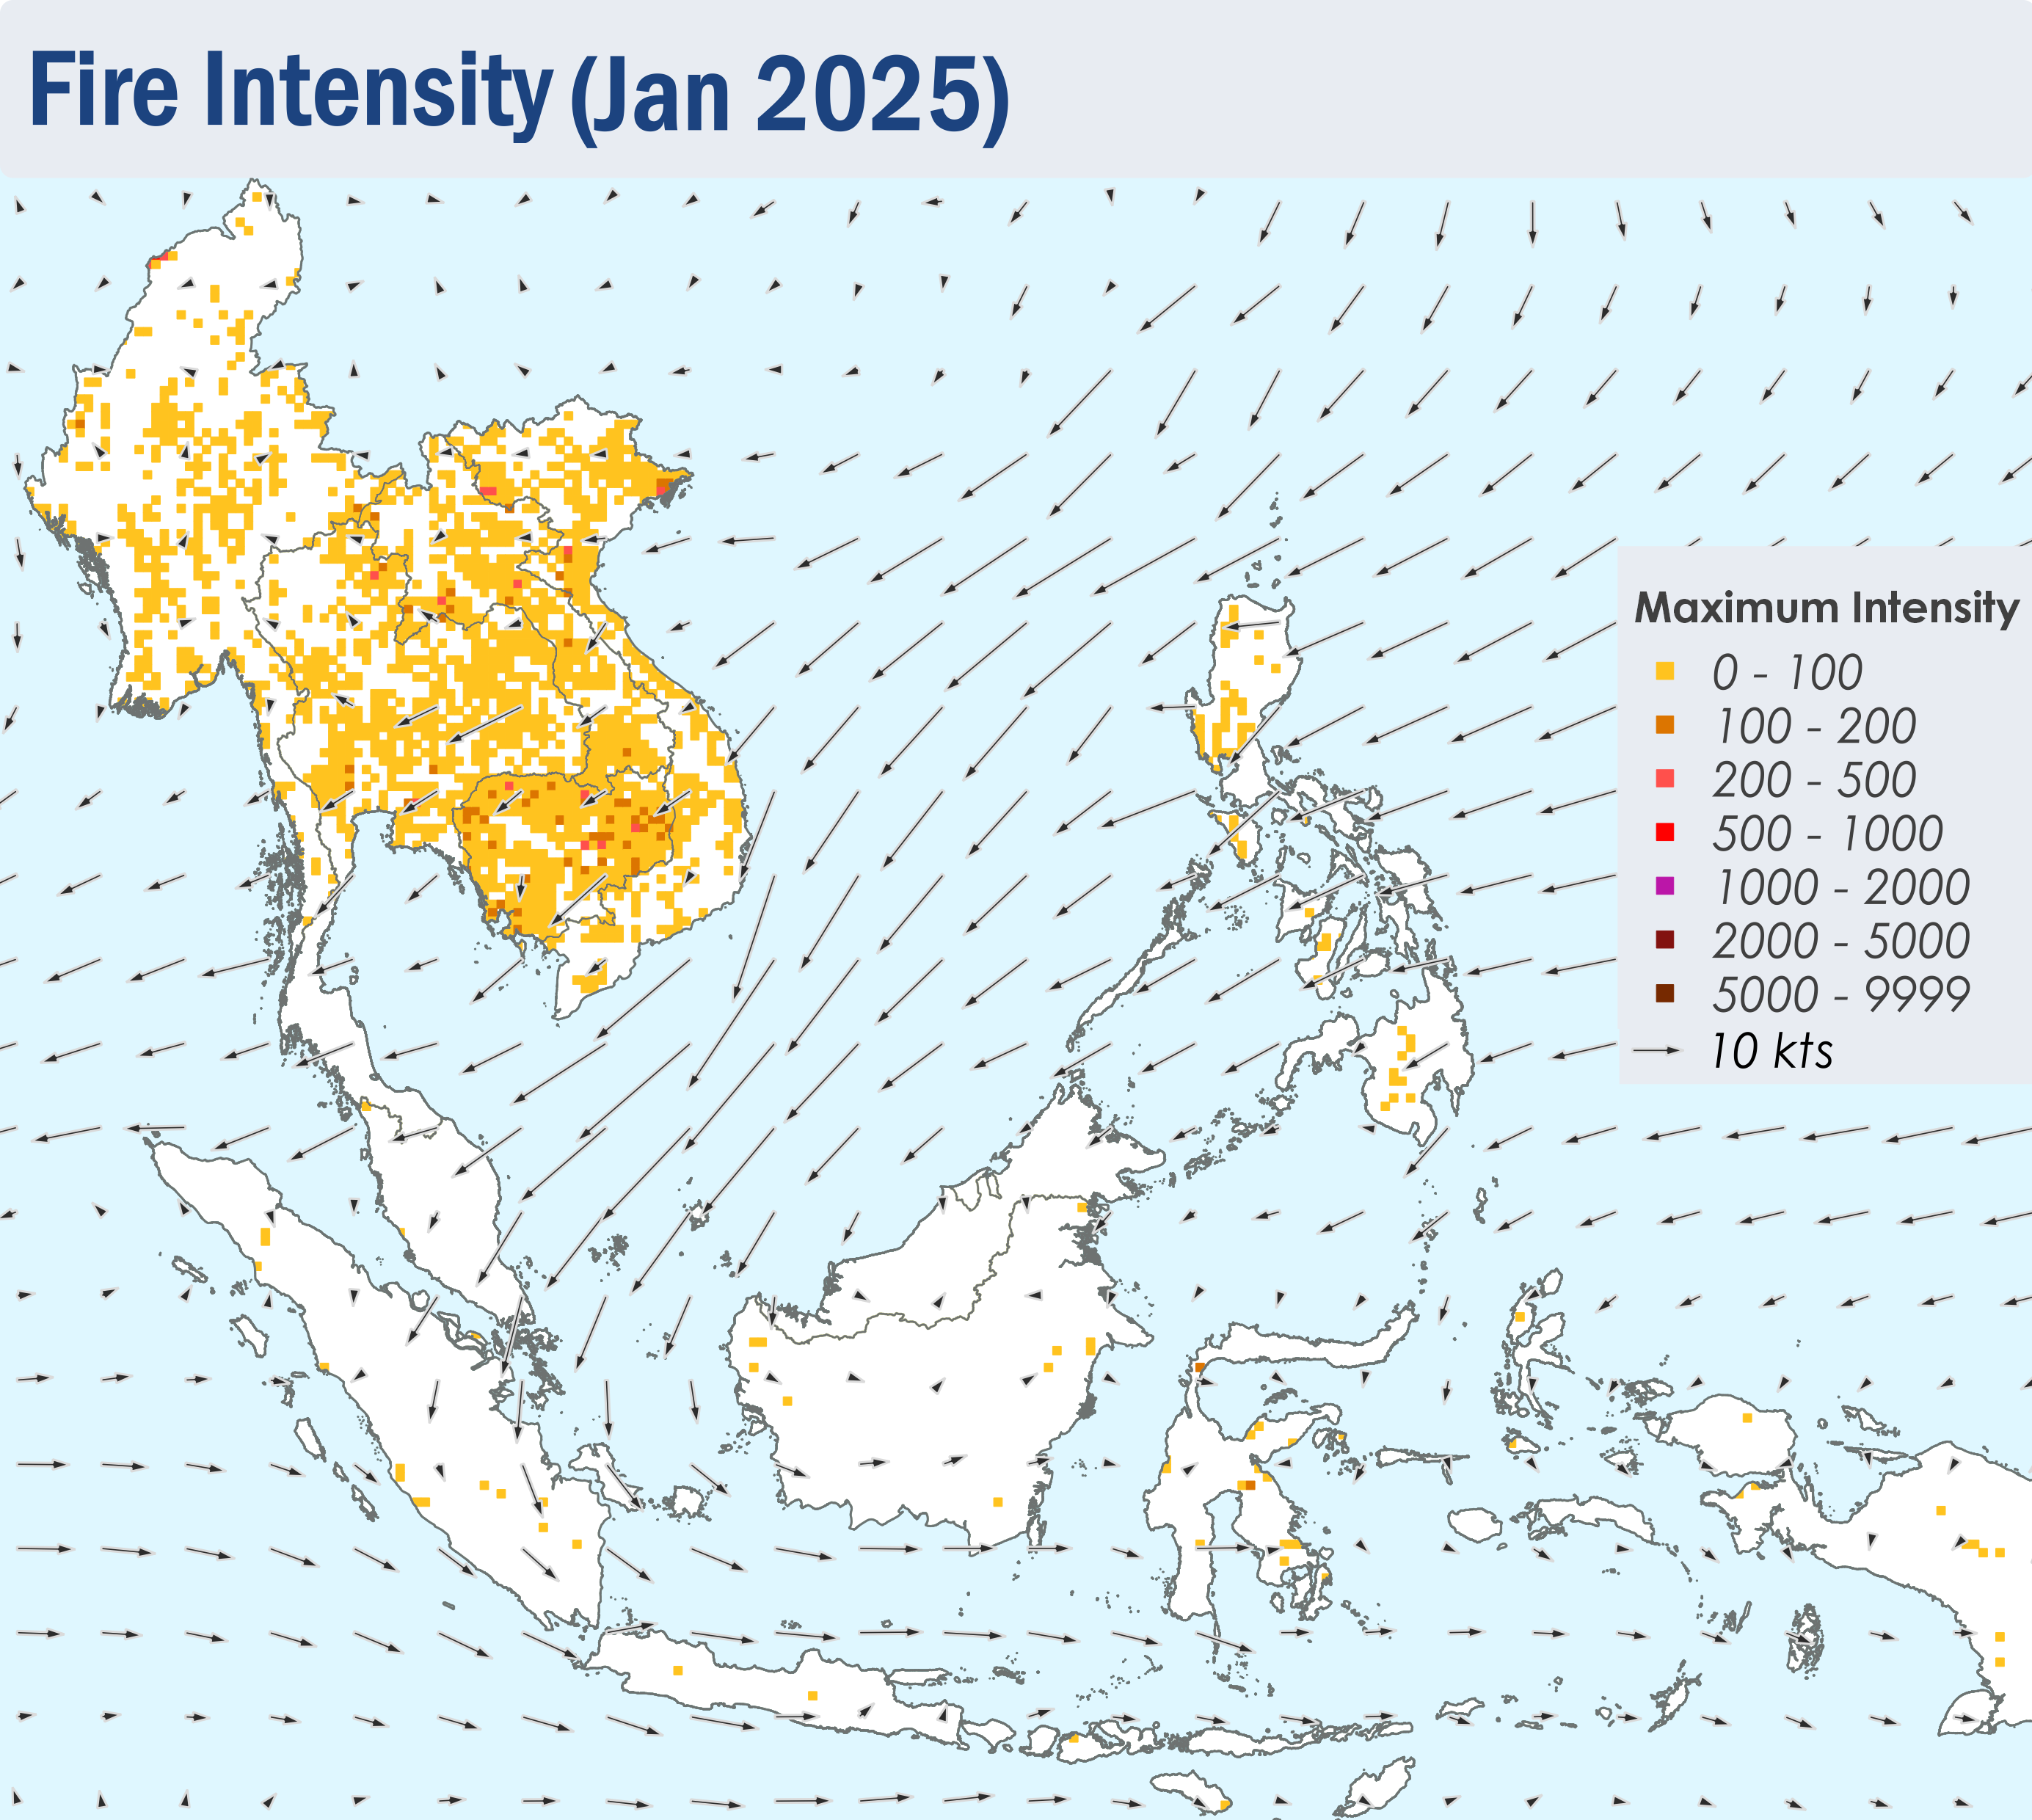
Figure 5: Maximum fire intensity in January 2025 based on NOAA-20 satellite surveillance.


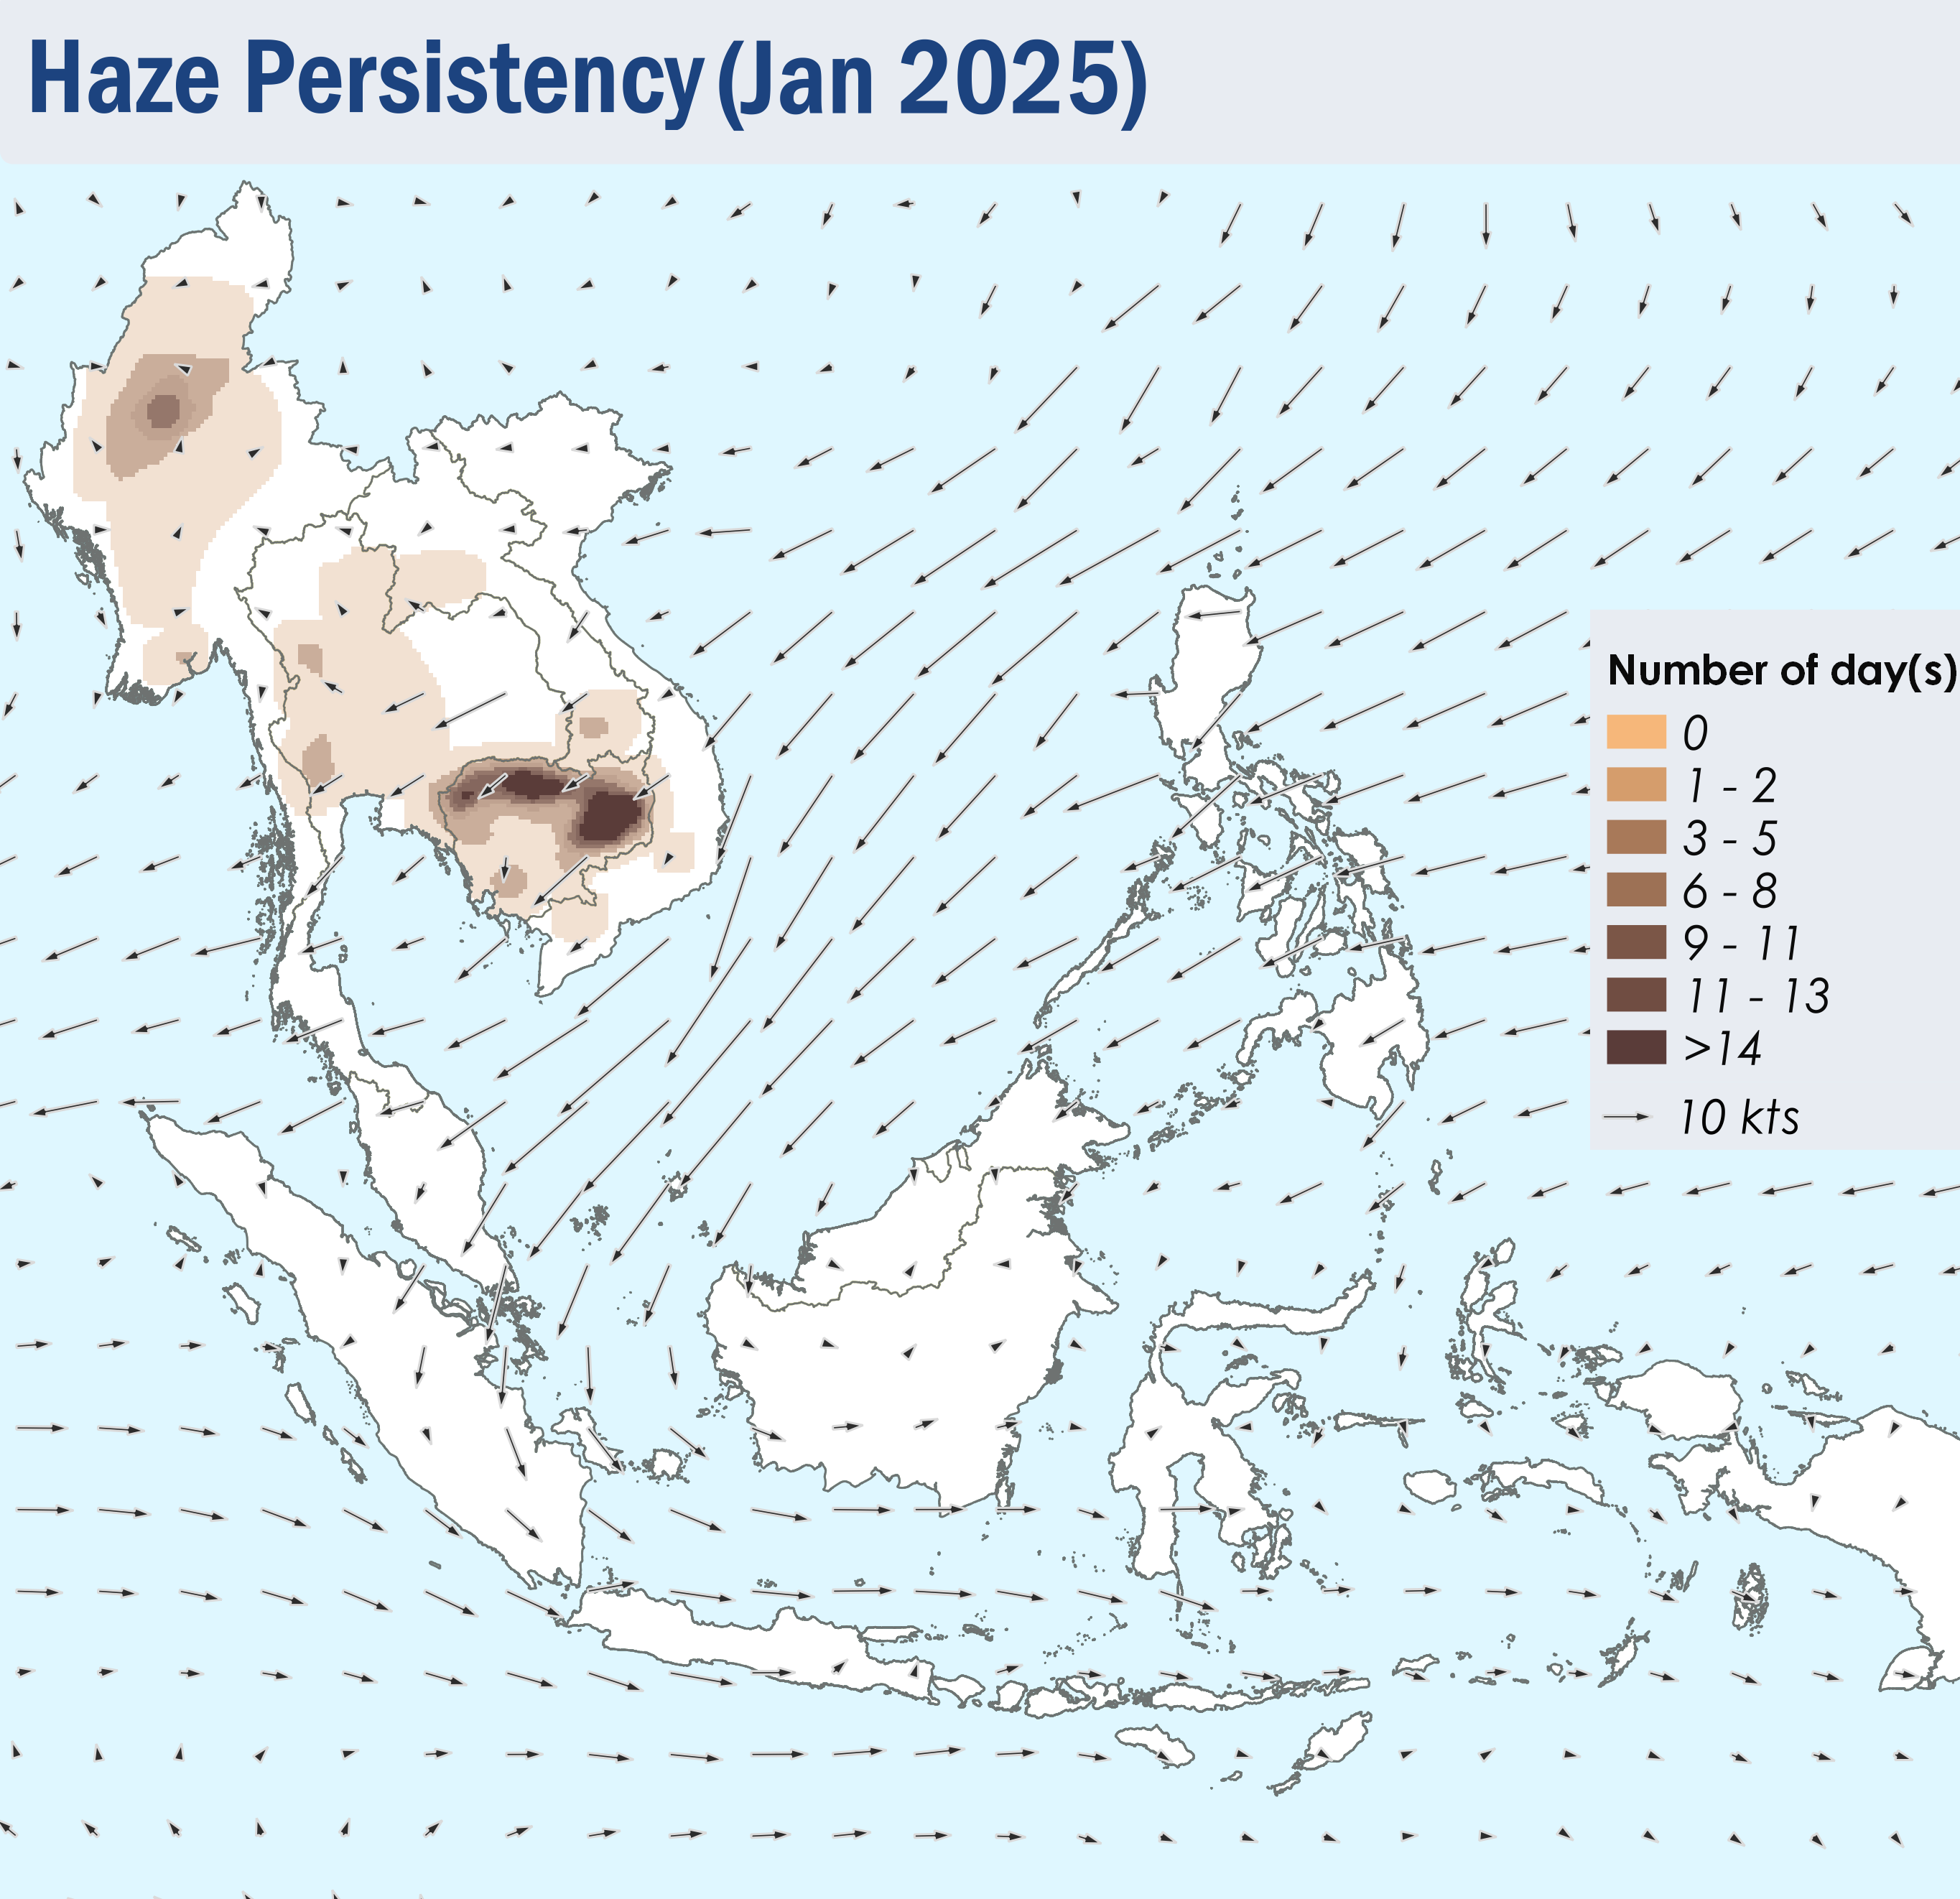
Figure 6: Number of days with moderate to dense smoke haze observed in January 2025 based on satellite imagery, ground observations, and air quality reports.


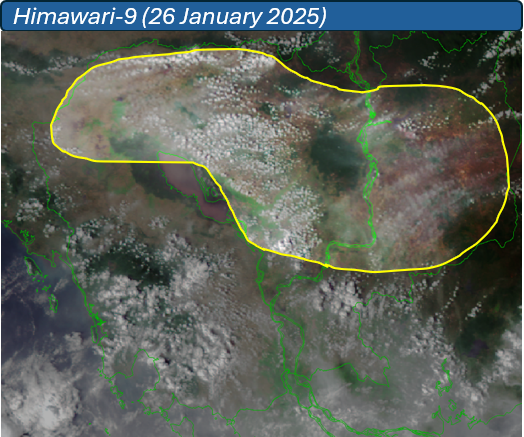
Figure 7: Moderate to dense smoke plumes were observed in the northern and eastern parts of Cambodia on 26 January 2025 (Source: Himawari-9 satellite surveillance.)


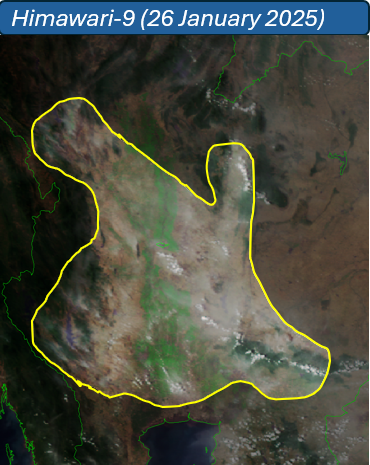
Figure 8: Moderate smoke plumes were observed in the northern and central parts of Thailand on 26 January 2025 (Source: Himawari-9 satellite surveillance.)


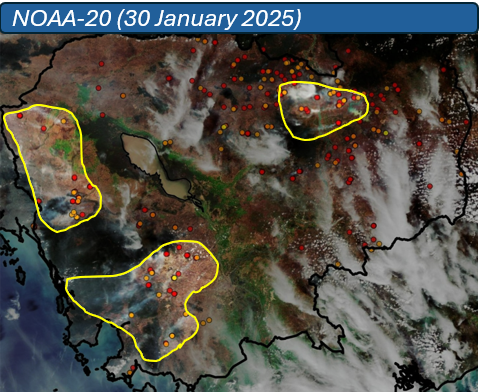
Figure 9: Moderate smoke plumes were observed in the northern, western and southern parts of Cambodia on 30 January 2025 (Source: NOAA-20 satellite surveillance.)