Category Archives: Regional Weather Review for Year 2025

Regional Weather Review for Year 2025

January 23, 2026

Review of Regional Weather for December 2025

Review of Regional Weather for December 2025


1. Overview

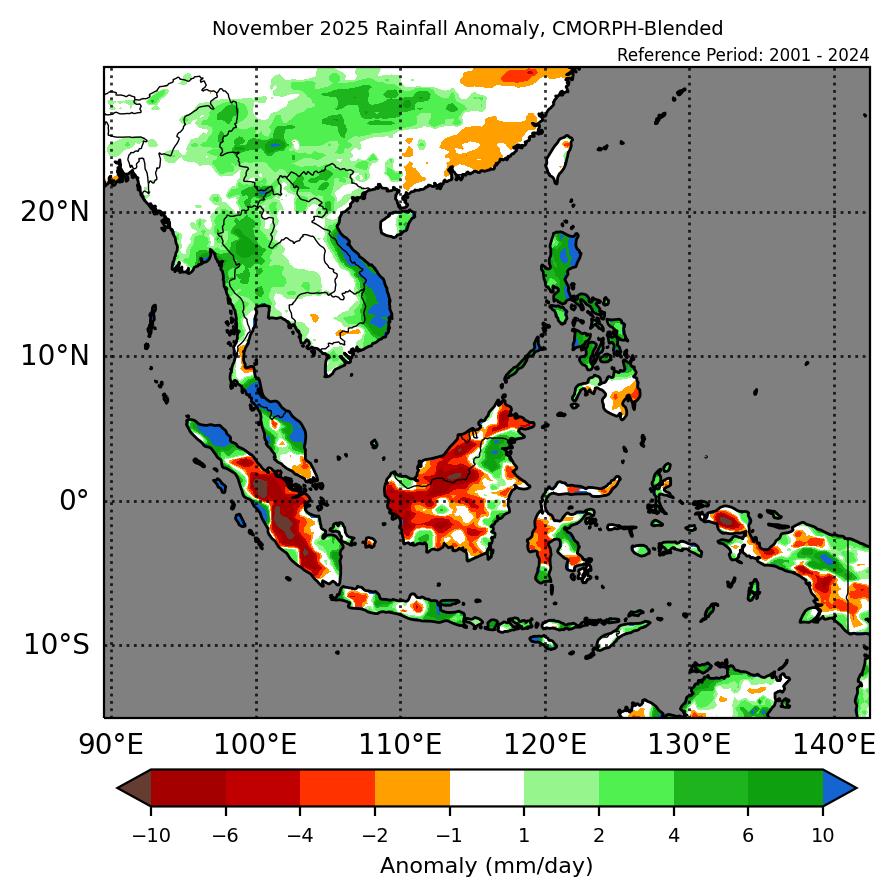
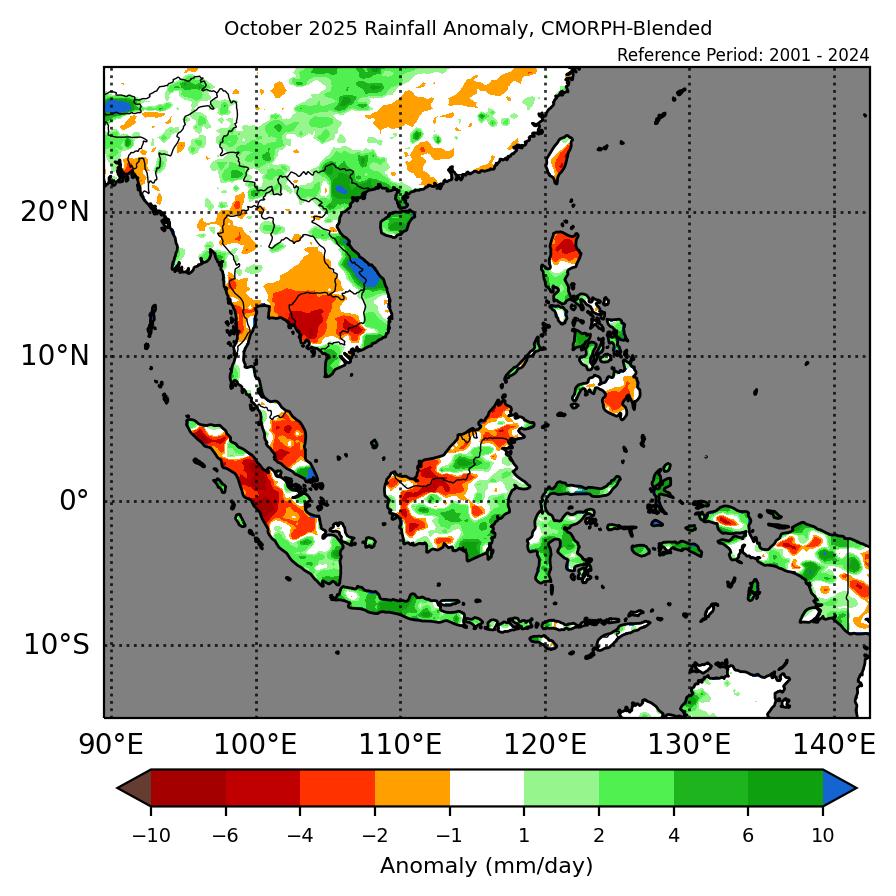
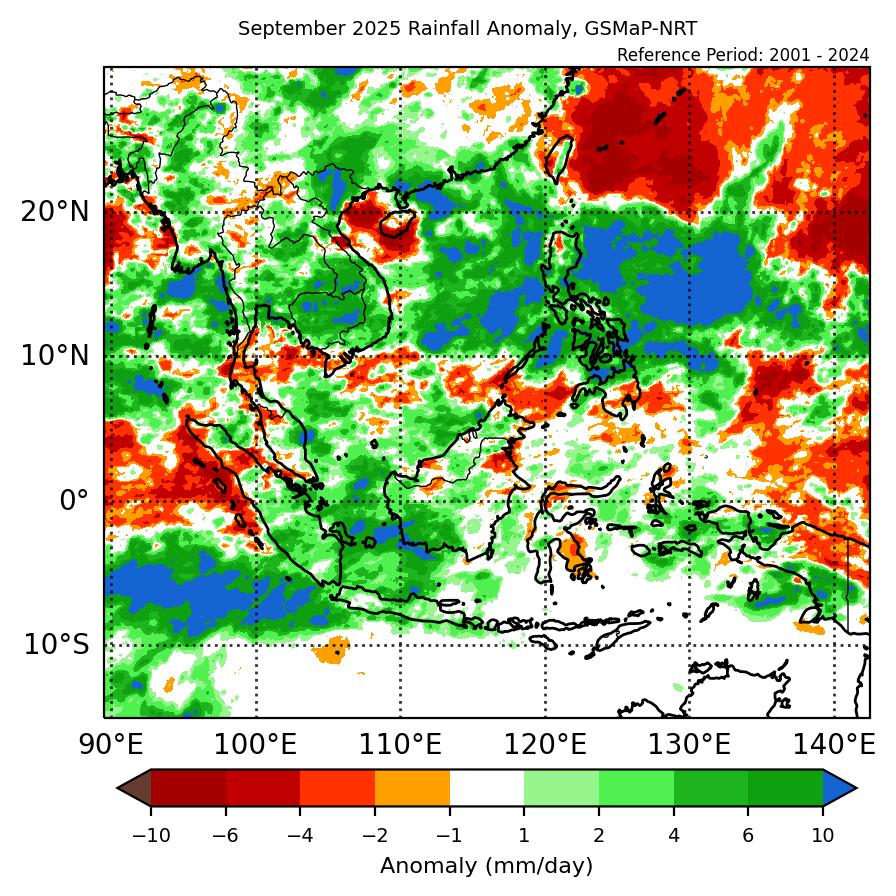
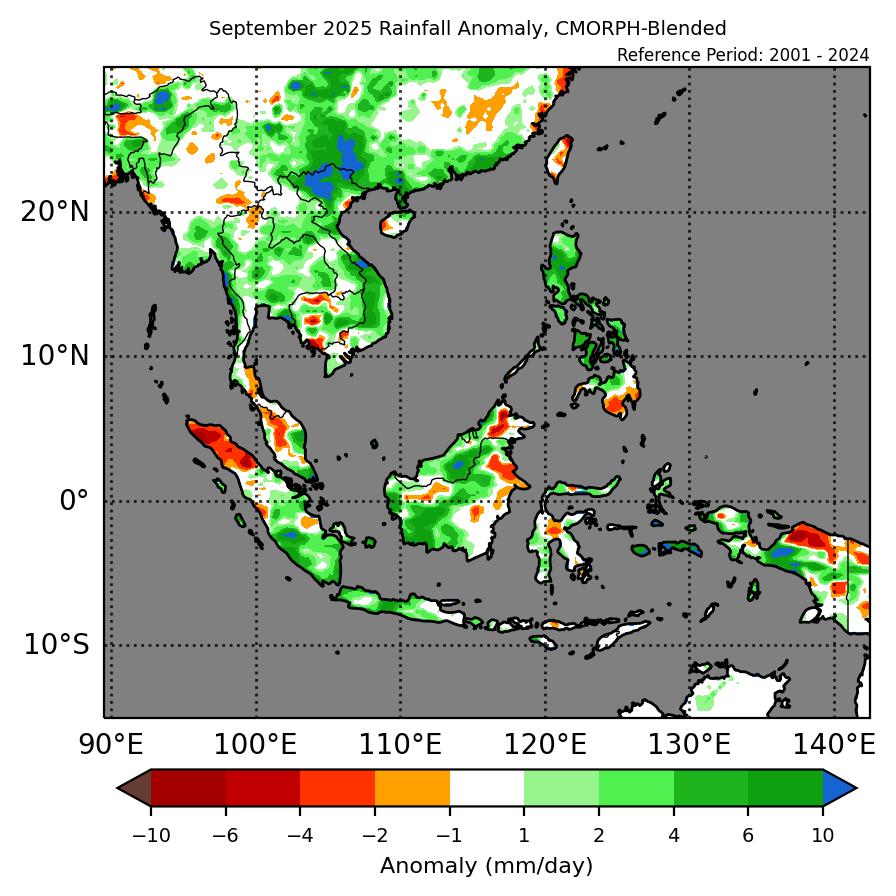
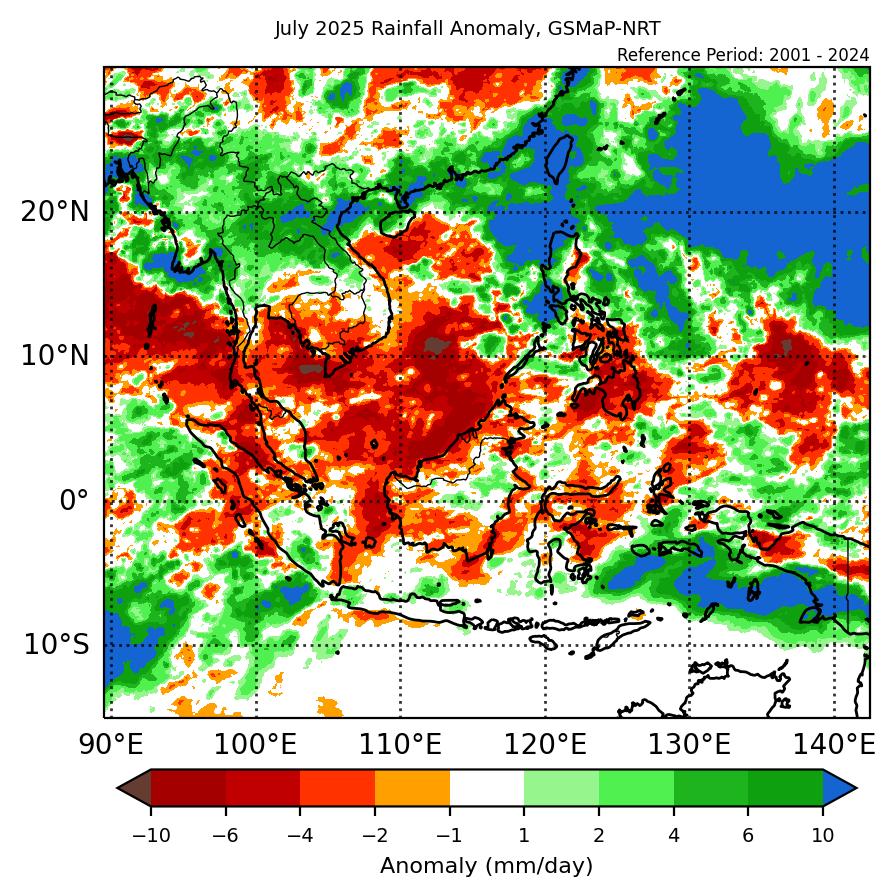
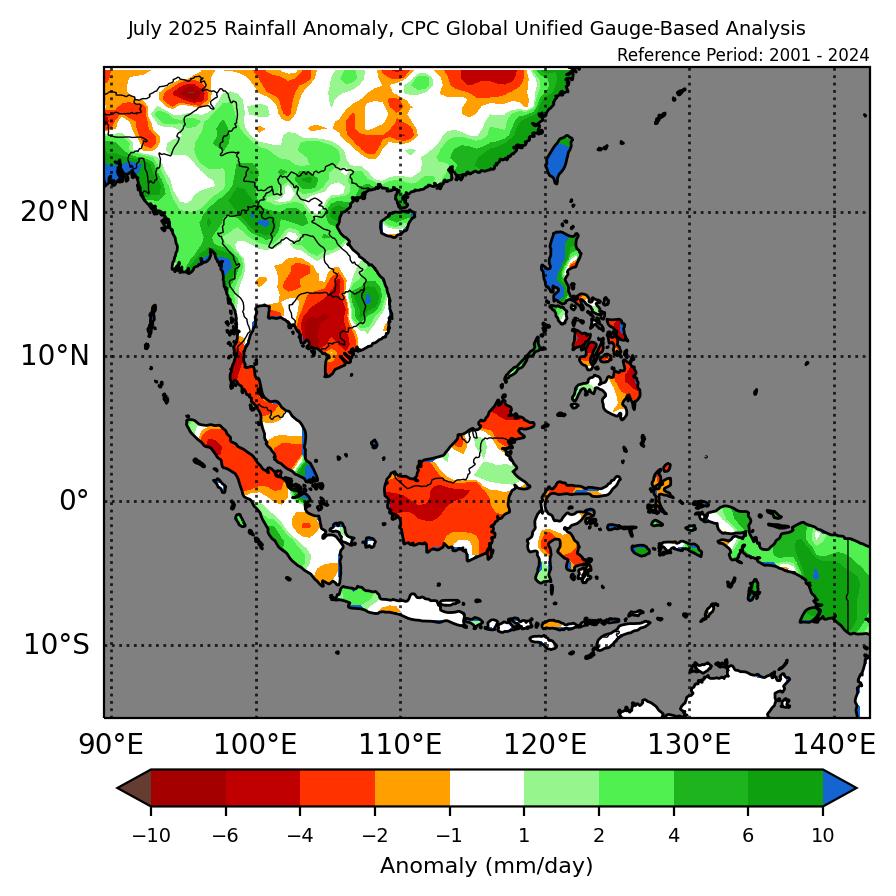
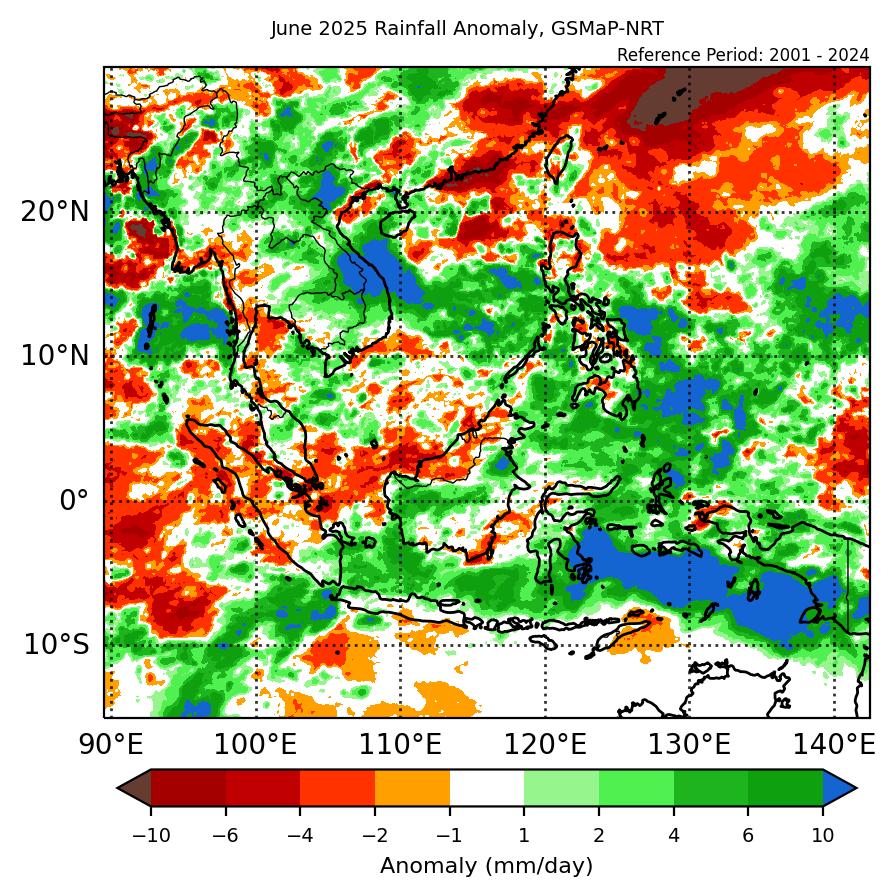
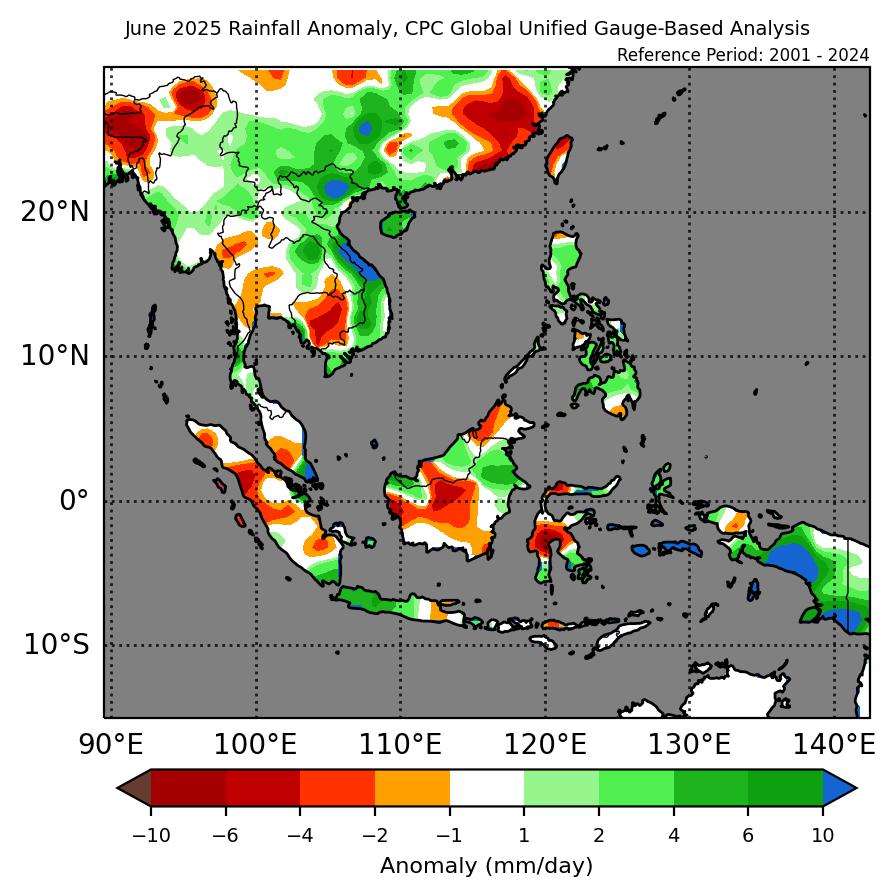
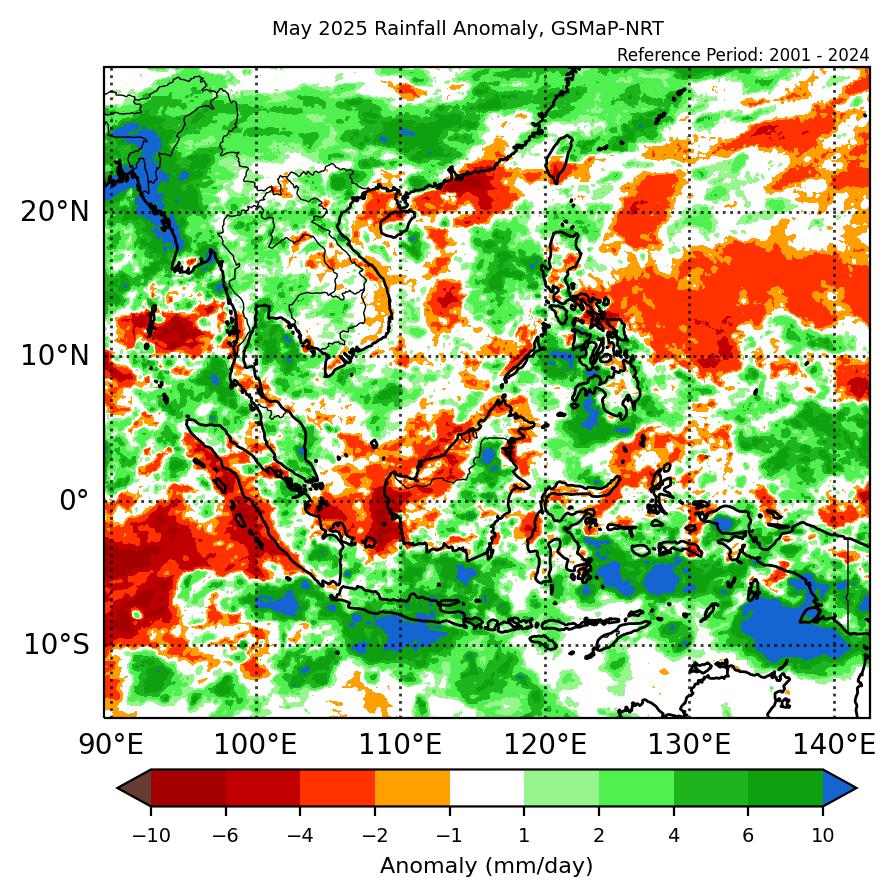
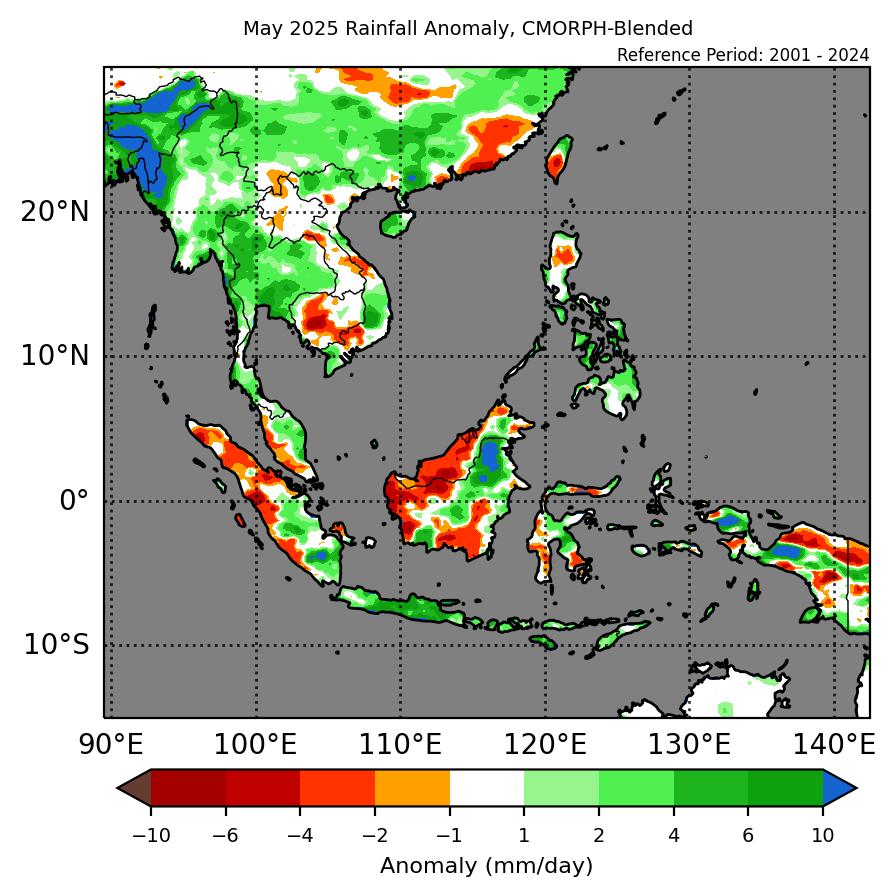
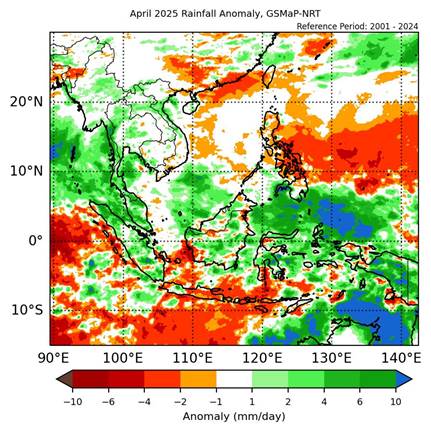
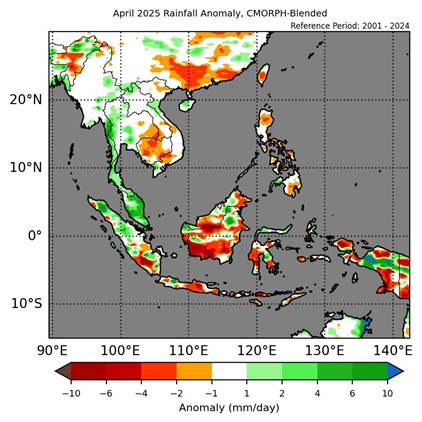
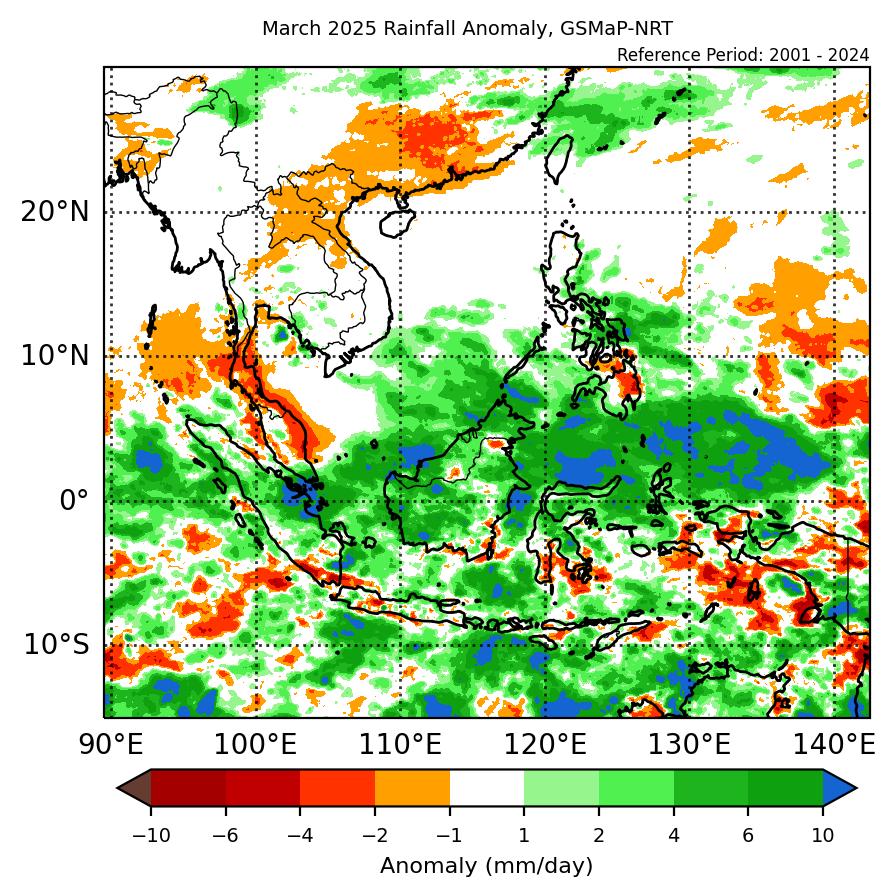
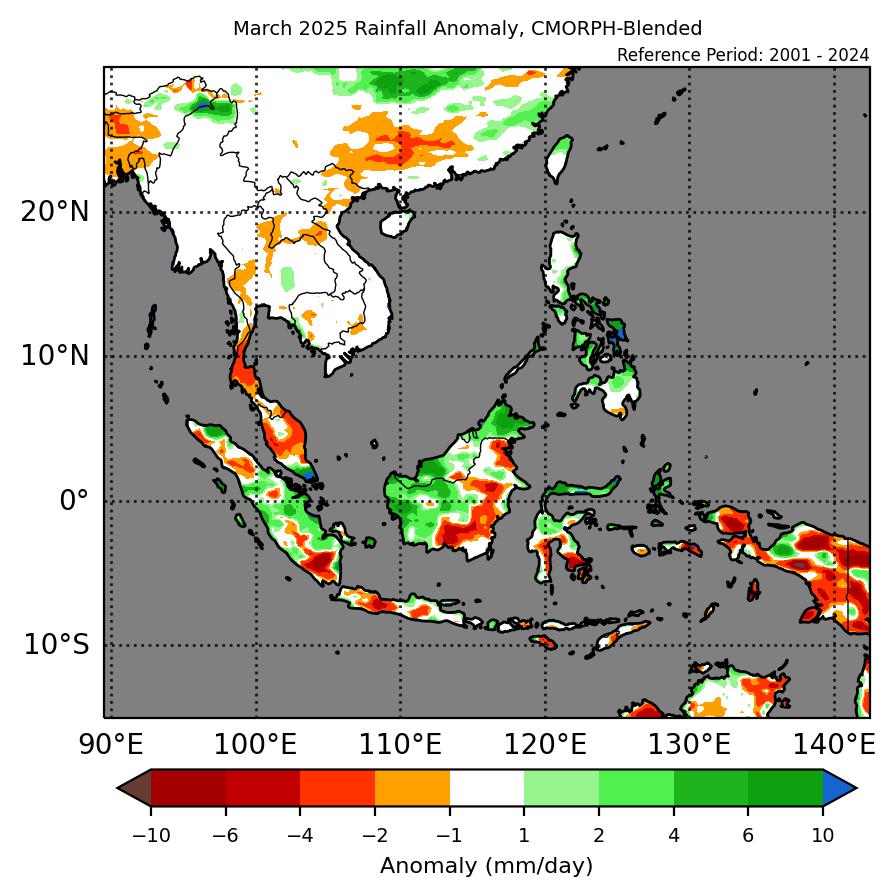
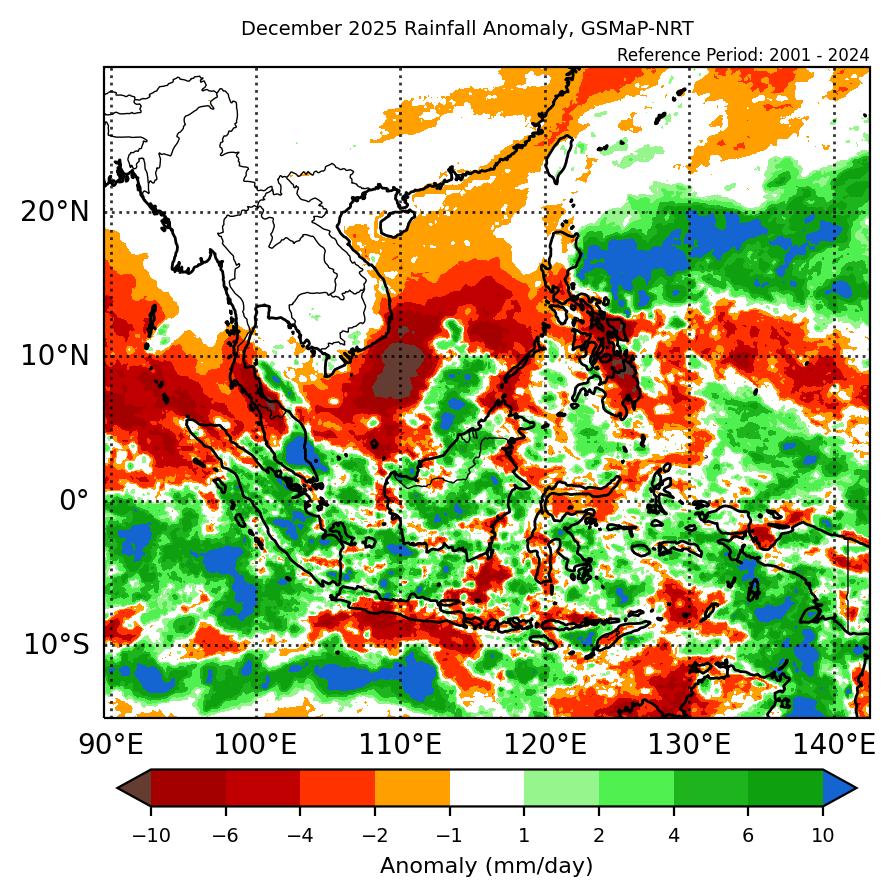
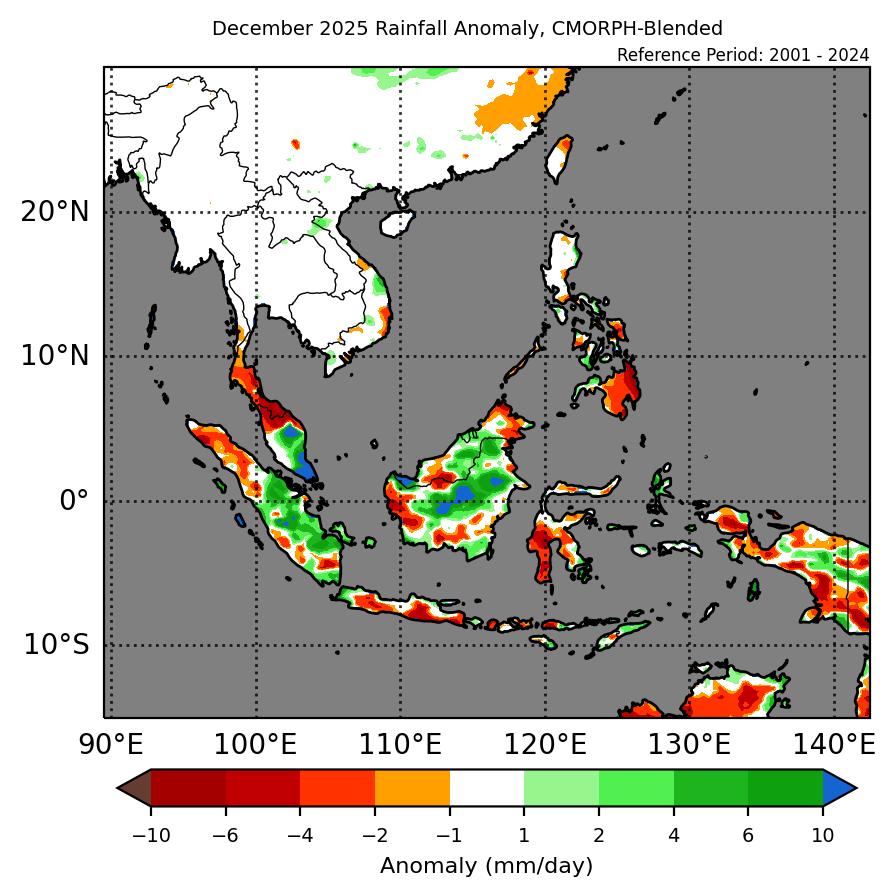
1.1 During December 2025, a mix of below- to above-average rainfall was recorded over the Maritime Continent with near-average rainfall over Mainland Southeast Asia (Figure 1). For the Maritime Continent, most of the equatorial region recorded above-average (wetter) anomalies with the surrounding region recording predominately below-average (drier) anomalies in both datasets (GSMaP-NRT and CMORPH-Blended). There were no notable anomalies over Mainland Southeast Asia, in line with the current dry season. The largest positive (wetter) anomalies were recorded over parts of Peninsular Malaysia and Borneo, with the largest negative (drier) anomalies over the northern Malay Peninsula and the southern Philippines.

1.2 The observed rainfall anomaly pattern of below-average rainfall over parts of the Maritime Continent outside of the equatorial region is consistent with the predictions from the subseasonal weather outlooks for December 2025 (24 November – 7 December 2025, 8 – 21 December 2025, and 22 December – 4 January 2026) although the above-average anomalies for most of the equatorial region were not predicted. The observations differ from the most likely tercile from the seasonal outlook for December 2025, which predicted an increase in chance of above-normal rainfall over parts of the northeastern and southern Maritime Continent.

era5_rainfall_anomalies
cmorph_bld_rainfall_anomalies
Figure 1: Rainfall anomalies for December 2025 based on GSMaP-NRT data (left) and CPC Global Unified Gauge-based Analysis data (right). The climatological reference period is 2001-2024. Green colour denotes above-average rainfall (wetter), while orange denotes below-average rainfall (drier).


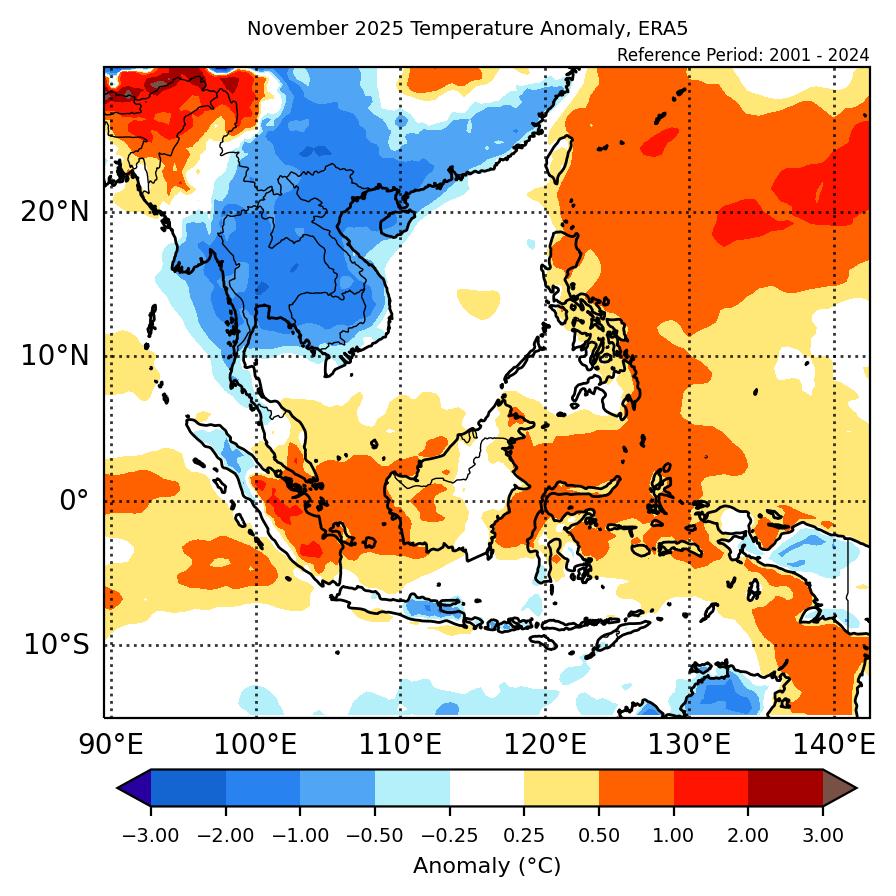
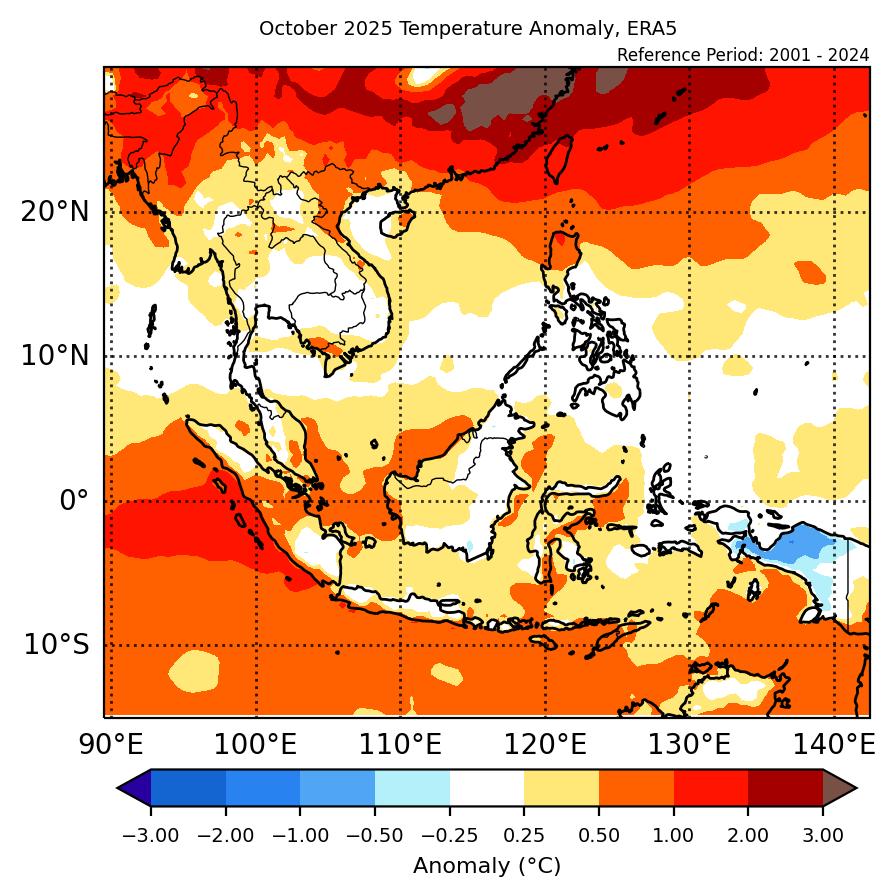
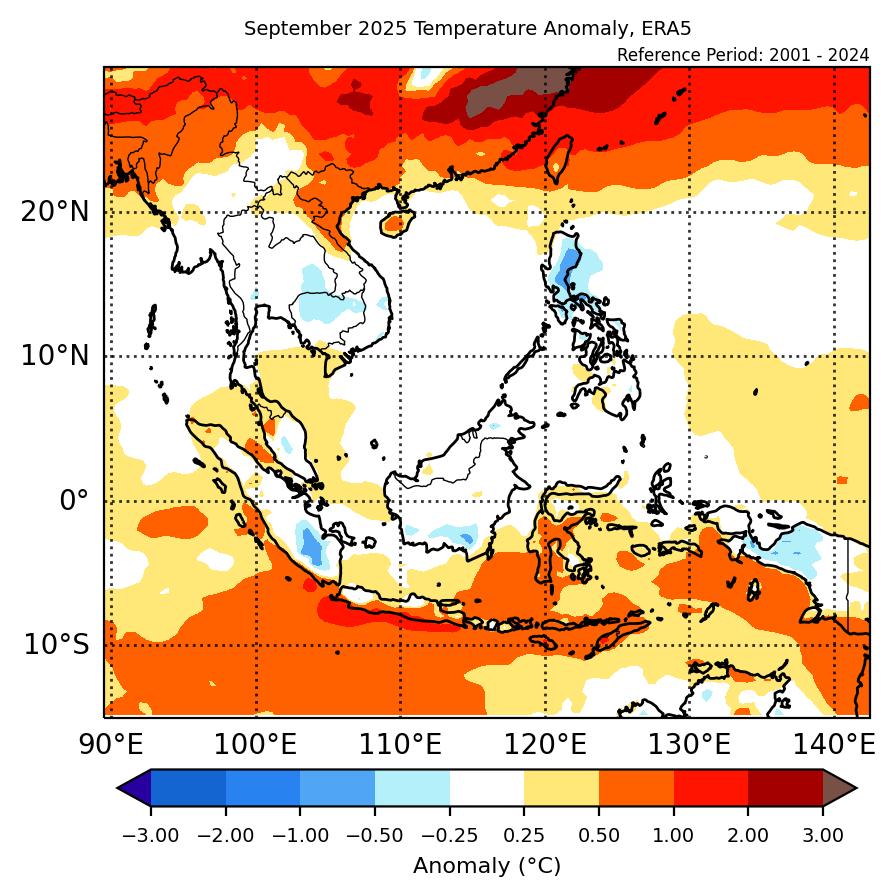
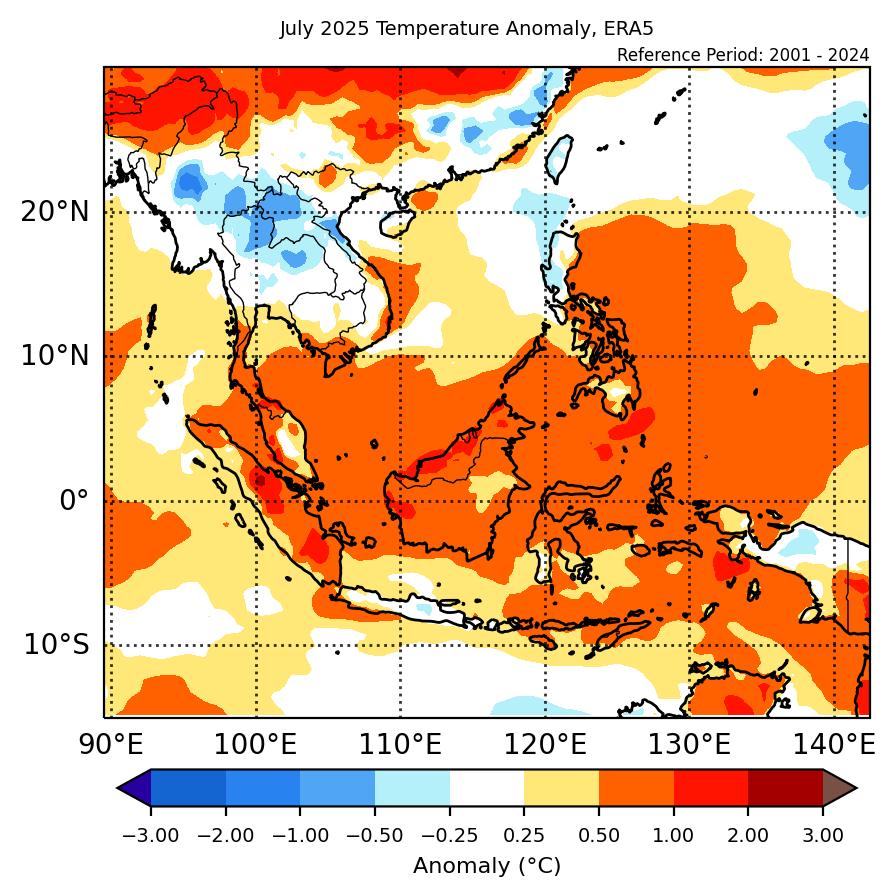
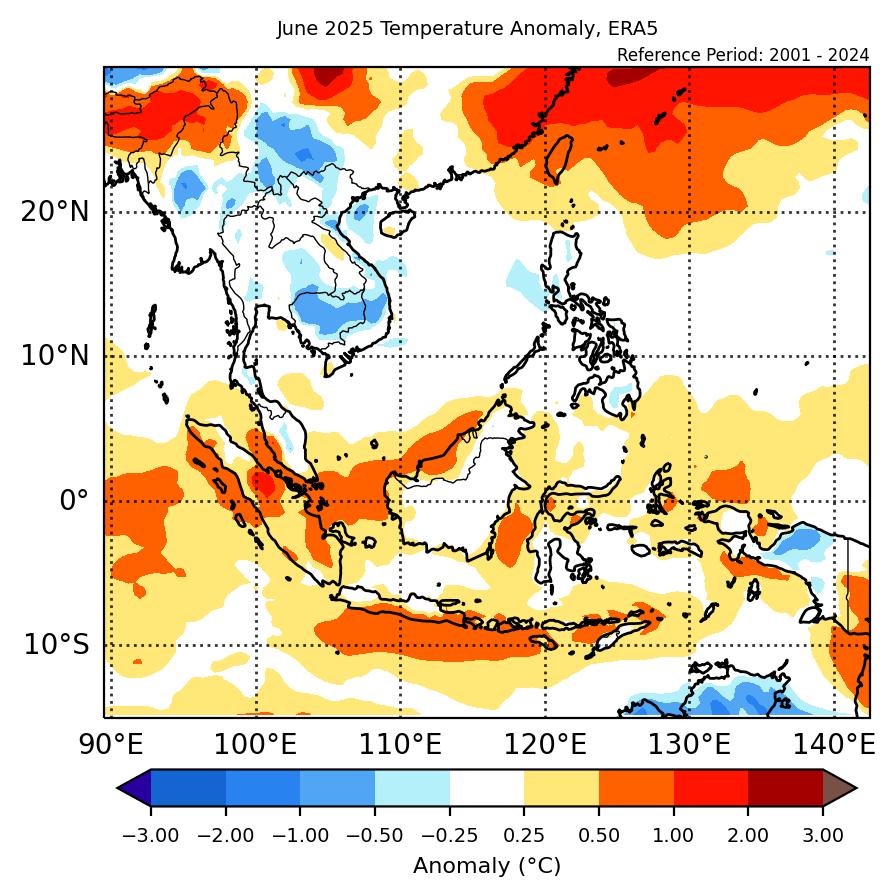
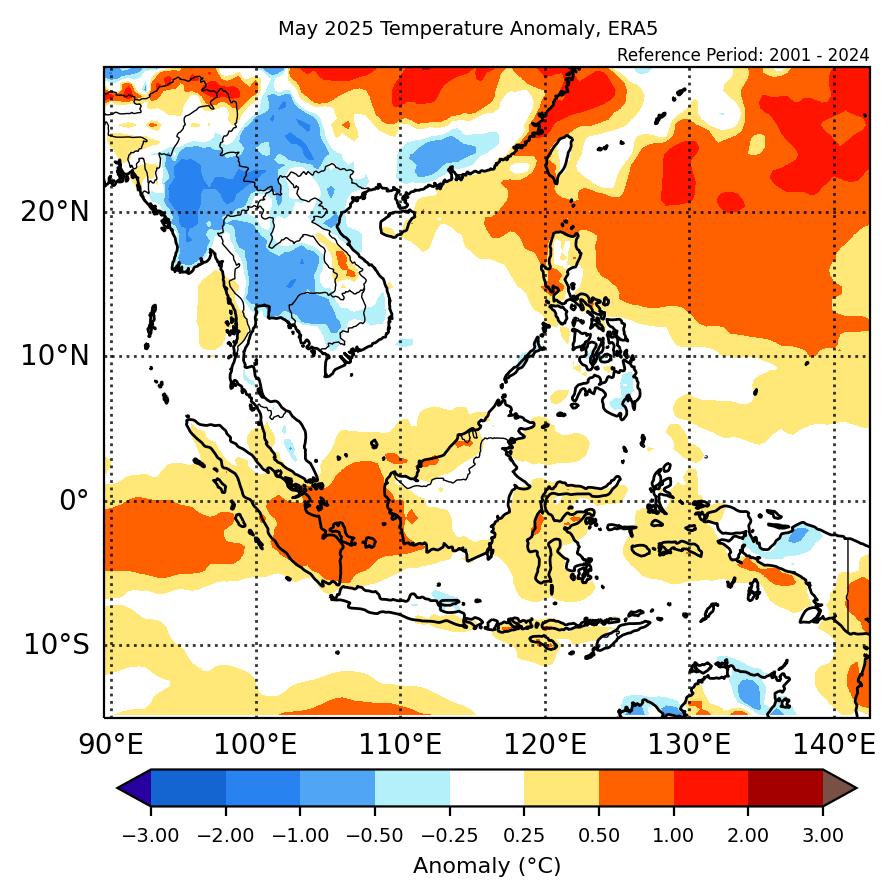
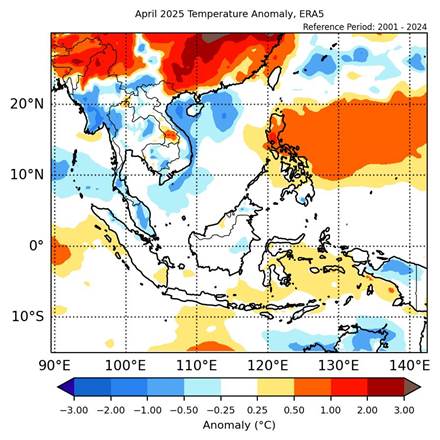
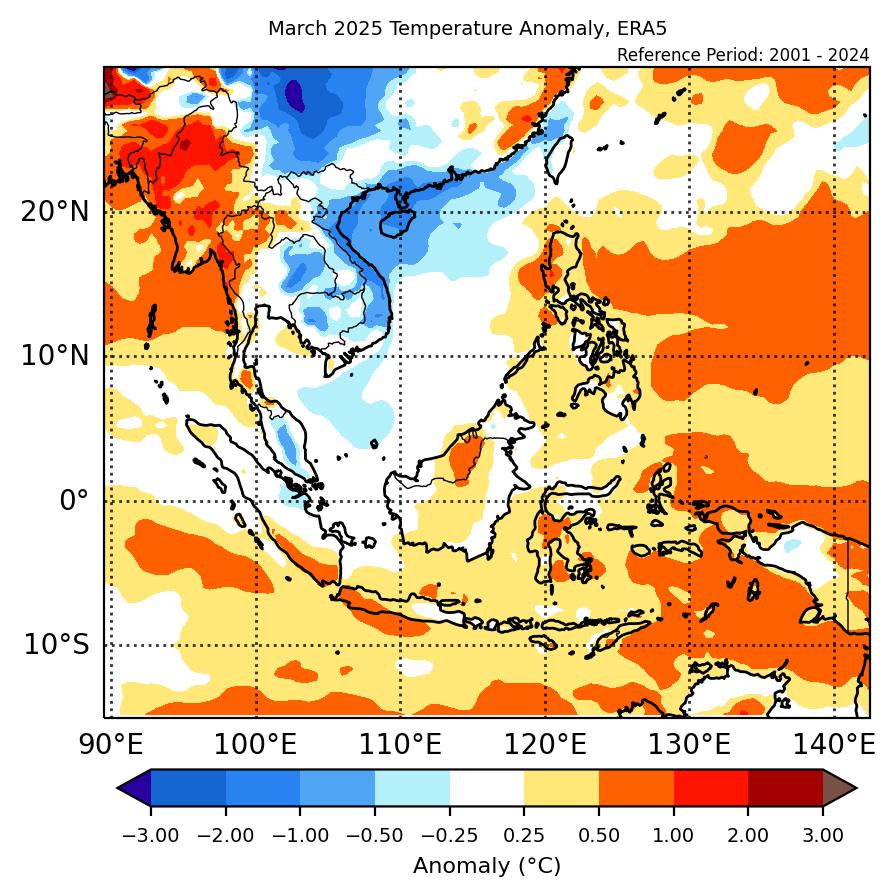
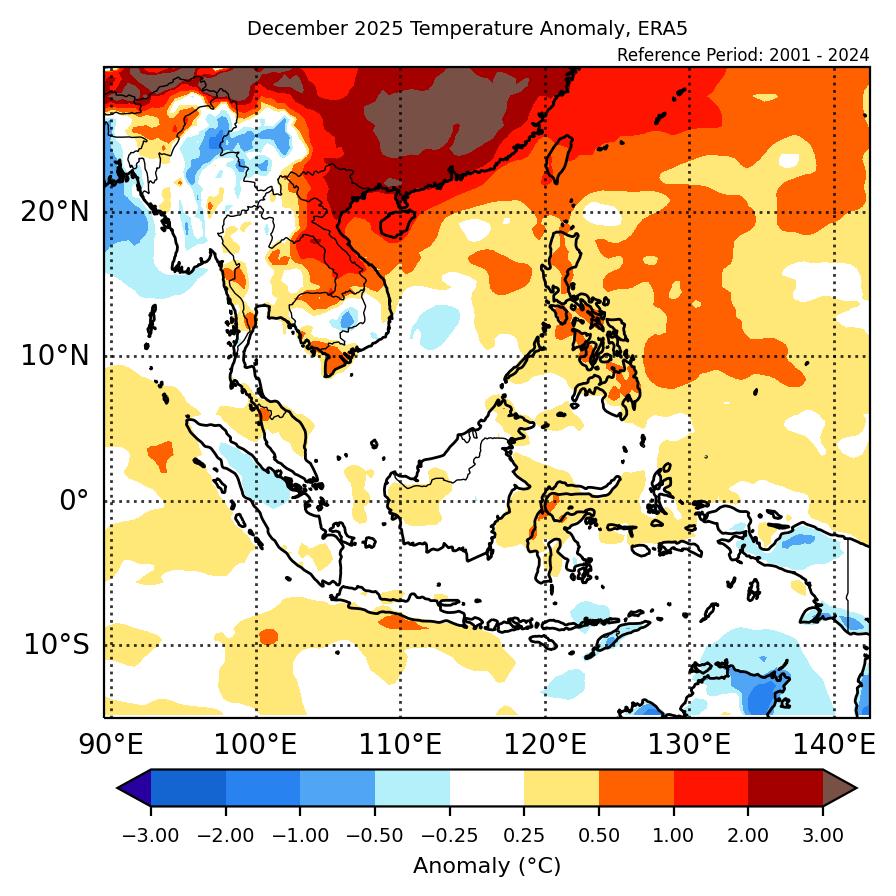
1.3 Above-average temperature was recorded over northeastern Mainland Southeast Asia and the northeastern Maritime Continent, with near-average temperature for much of the rest of Southeast Asia (Figure 2). The warmest anomalies (1°C – 3°C above average) were recorded over northern and central Viet Nam, while the coolest anomalies (0.5°C – 1°C below average) were recorded over northern Myanmar.

era5_temperature_anomalies
Figure 2: Temperature anomalies for December 2025 based on ERA-5 reanalysis. The climatological reference period is 2001-2024. Red colour denotes above-average temperature (warmer), while blue denotes below-average temperature (colder).


2. Climate Drivers

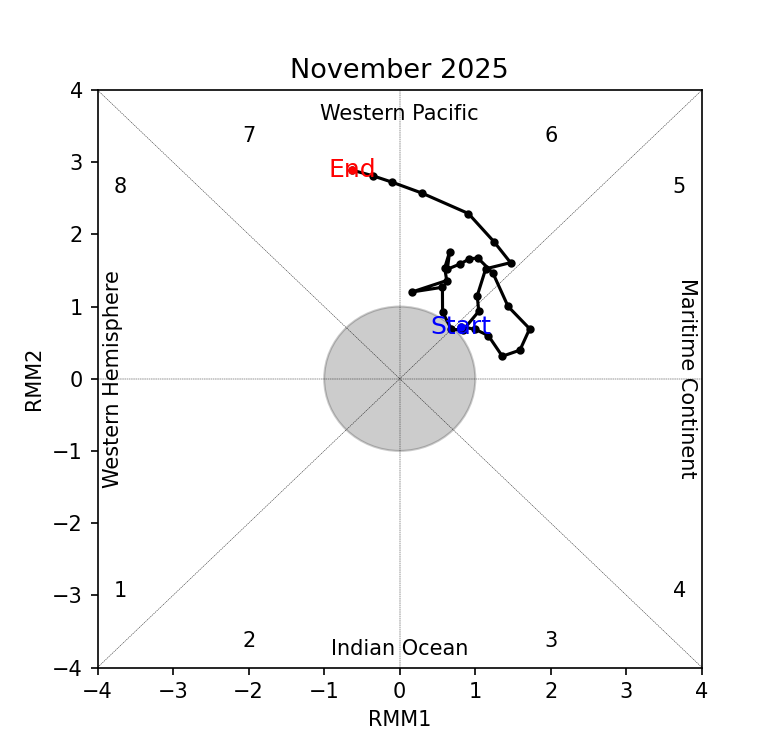
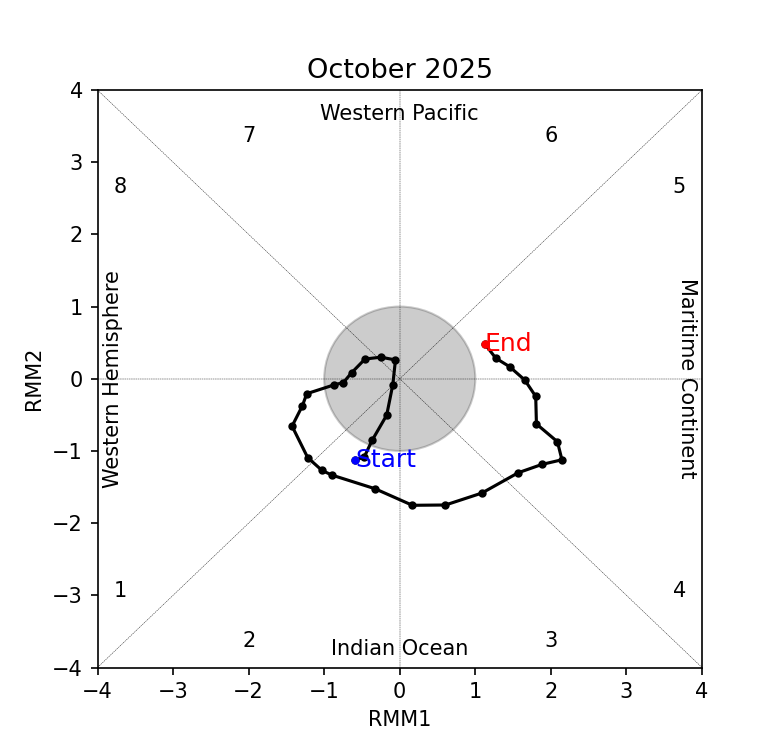
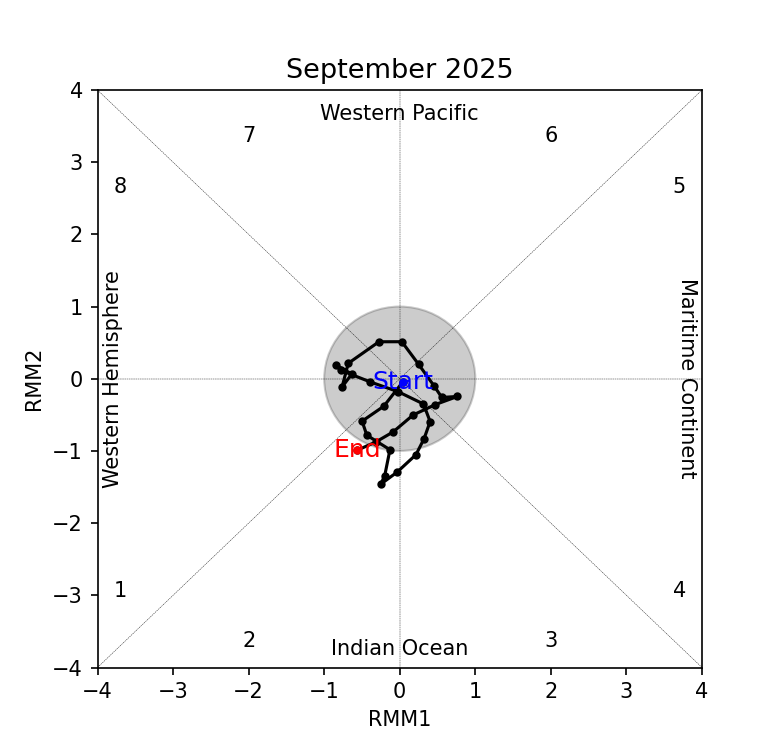
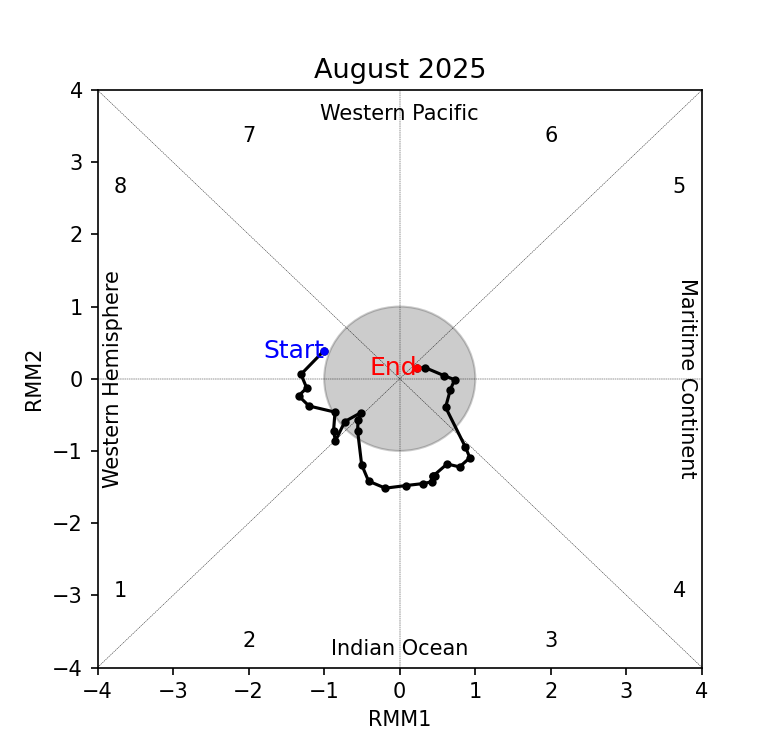
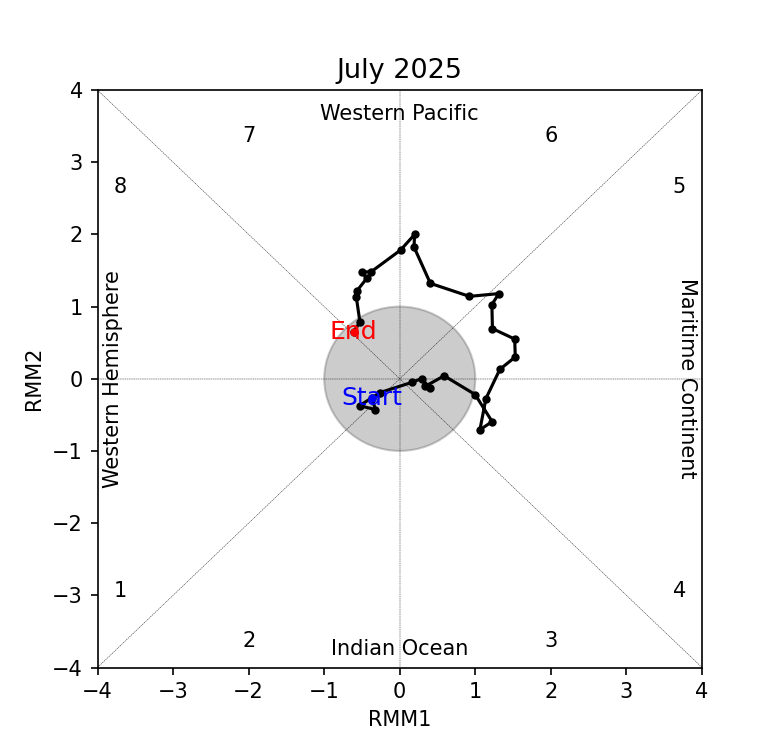
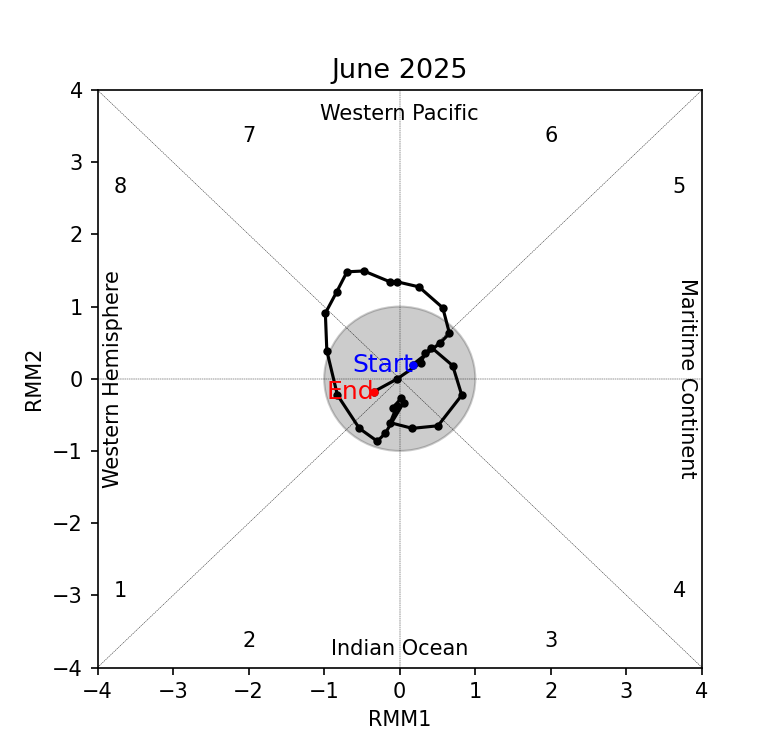
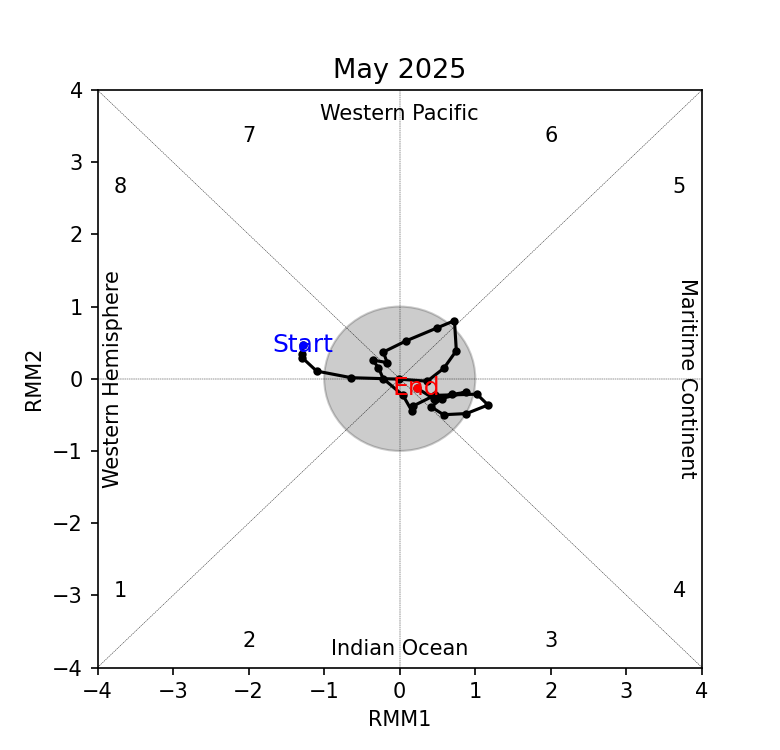
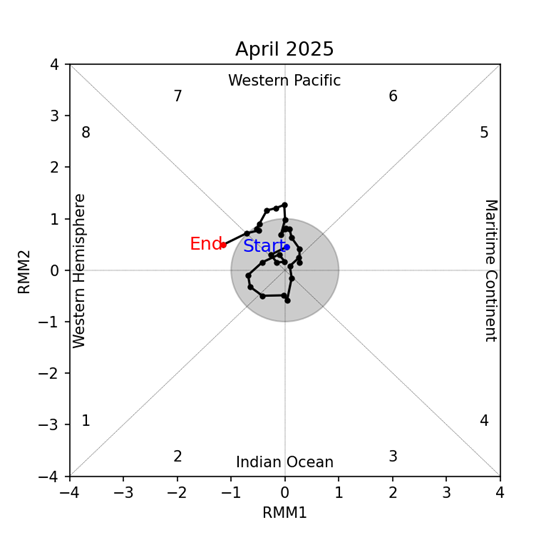
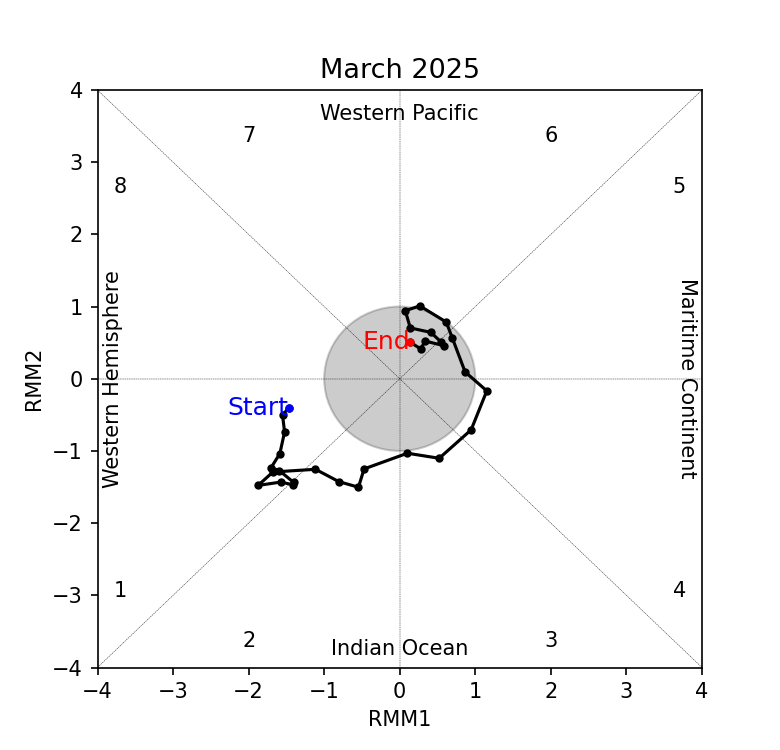
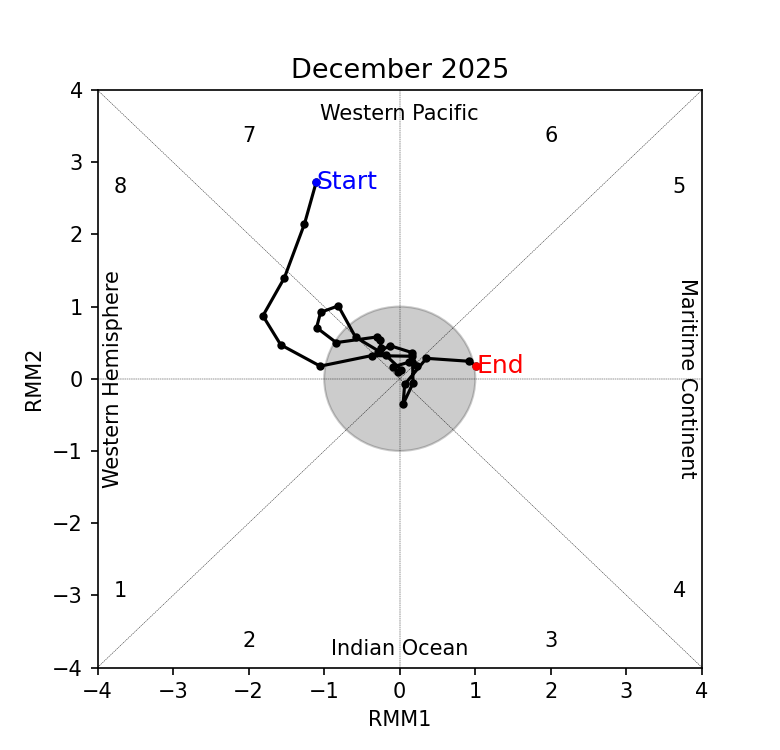
2.1 At the start of December, the Madden-Julian Oscillation (MJO) was present over the Western Pacific (Phase 7) based on the RMM diagram (Figure 3). The signal propagated eastwards, weakening over Western Hemisphere (Phase 8) and entering the unit circle by Week 2. For the rest of December there was no sustained MJO signal based on the RMM index. At this time of the year, Phases 1 and 2 tend to bring drier conditions to the eastern Maritime Continent, while Phases 4 and 5 tend to bring wetter conditions to much of the Maritime Continent. However, these patterns are not clear in Figure 1, indicating other drivers and weather systems likely had a stronger influence on the region’s rainfall.

mjo_phase_diagram


Figure 3: The MJO phase diagram. The diagram illustrates the movement of the MJO through different phases, which correspond to different locations along the equator (denoted in the text with the first day of the month in blue and the last day of the month in red). The distance of the index from the centre of the diagram is related to the strength of the MJO. Values within the grey circle are considered weak or indiscernible (data from the Bureau of Meteorology, Australia).


2.2 La Niña conditions persisted in December 2025. La Niña events tend to bring wetter-than-average conditions to much of the Maritime Continent during this time of the year. The Indian Ocean Dipole (IOD) returned to neutral in December 2025.


December 22, 2025

Review of Regional Weather for November 2025

Review of Regional Weather for November 2025


1. Overview

1.1 During November 2025, a mix of below- to above-average rainfall was recorded for Southeast Asia (Figure 1). For the Maritime Continent, most of the northeastern and northwestern regions recorded positive (wetter) anomalies in both datasets (GSMaP-NRT and CMORPH-Blended), with a mix of below- to above-average rainfall recorded over the equatorial region. Over Mainland Southeast Asia, above-average rainfall was recorded mainly over the central and eastern regions. Generally, CMORH-Blended (Figure 1, right) recorded more extensive negative (drier) anomalies over the equatorial region. The largest positive (wetter) anomalies were recorded over the northwestern Maritime Continent , with the largest negative (drier) anomalies over central Borneo.

1.2 The observed rainfall anomaly pattern of above-average rainfall over the Mainland Southeast Asia and below-average rainfall over the central Maritime Continent is consistent with the predictions from the subseasonal weather outlooks for November 2025 (27 October – 9 November 2025, 10– 23 November 2025, and 24 November – 7 December 2025).The observations are also somewhat consistent with the seasonal outlook for November 2025, which predicted an increase in chance of above-normal rainfall over most of Mainland Southeast Asia and the northeastern Maritime continent, with an increase in chance of below-normal rainfall over the central Maritime Continent.

era5_rainfall_anomalies
cmorph_bld_rainfall_anomalies
Figure 1: Rainfall anomalies for November 2025 based on GSMaP-NRT data (left) and CPC Global Unified Gauge-based Analysis data (right). The climatological reference period is 2001-2024. Green colour denotes above-average rainfall (wetter), while orange denotes below-average rainfall (drier).


1.3 Below-average temperatures were recorded over most of Mainland Southeast Asia in November 2025, while near- to above-average temperatures were recorded over most of Maritime Continent (Figure 2). The warmest anomalies (1°C – 2°C above average) were recorded over east central Sumatra, while the coolest anomalies (0.5°C – 1°C below average) were recorded over central Mainland Southeast Asia.

era5_temperature_anomalies
Figure 2: Temperature anomalies for November 2025 based on ERA-5 reanalysis. The climatological reference period is 2001-2024. Red colour denotes above-average temperature (warmer), while blue denotes below-average temperature (colder).


2. Climate Drivers

2.1 At the start of November, the Madden-Julian Oscillation (MJO) was present over the Maritime Continent (Phase 5) based on the RMM diagram (Figure 3). It stalled over the Western Pacific (Phase 6) during Week 2 and then weakening in Phase 6 during the third week. The MJO strengthened again in Phase 6 towards the end of Week 3 and resumed its eastward propagation, reaching phase 7 in Week 4. At this time of the year, Phases 1 and 2 tend to bring drier conditions to the eastern Maritime Continent, while Phases 4 and 5 tend to bring wetter conditions to much of the Maritime Continent. However, these patterns are not clear in Figure 1, indicating other drivers and weather systems likely had a stronger influence on the region’s rainfall.

mjo_phase_diagram


Figure 3: The MJO phase diagram. The diagram illustrates the movement of the MJO through different phases, which correspond to different locations along the equator (denoted in the text with the first day of the month in blue and the last day of the month in red). The distance of the index from the centre of the diagram is related to the strength of the MJO. Values within the grey circle are considered weak or indiscernible (data from the Bureau of Meteorology, Australia).


2.2 A negative Indian Ocean Dipole (IOD) was present in November 2025. Negative IOD events tend to bring wetter conditions to parts of the region, particularly the southern Maritime Continent, in line with the positive rainfall anomalies in Figure 1. La Niña conditions were also present. La Niña events tend to bring wetter-than-average conditions to much of the Maritime Continent during this time of the year.


November 26, 2025

Review of Regional Weather for October 2025

Review of Regional Weather for October 2025


1. Overview

1.1 During October 2025, a mix of below- to above-average rainfall was recorded for Southeast Asia (Figure 1). For the Maritime Continent, most of the southern and eastern regions recorded positive (wetter) anomalies in both datasets (GSMaP-NRT and CMORPH-Blended), with below-average rainfall recorded over the western region and parts of the Philippines. Over Mainland Southeast Asia, below-average rainfall was recorded over the southern region, with near- to above-average rainfall elsewhere. Generally, CMORH-Blended (Figure 1, right) recorded more extensive negative (drier) anomalies over the western Maritime Continent and southern Mainland Southeast Asia. The largest positive (wetter) anomalies were recorded over eastern Mainland Southeast Asia, with the largest negative (drier) anomalies over the western Maritime Continent.

1.2 The observed rainfall anomaly pattern of above-average rainfall over the southern and southeastern Maritime Continent is consistent with the predictions from the subseasonal weather outlooks for October 2025 (1 – 12 Oct 2025 and 13 – 26 Oct 2025). However, the below-average rainfall observed was not predicted in the subseasonal weather outlook. The observations are also somewhat consistent with the seasonal outlook for October 2025, which predicted an increase in chance of above-normal rainfall in the southern and eastern Maritime Continent, and an increase in chance of below-normal rainfall in the western Maritime Continent.

era5_rainfall_anomalies
cmorph_bld_rainfall_anomalies
Figure 1: Rainfall anomalies for October 2025 based on GSMaP-NRT data (left) and CPC Global Unified Gauge-based Analysis data (right). The climatological reference period is 2001-2024. Green colour denotes above-average rainfall (wetter), while orange denotes below-average rainfall (drier).


1.3 Near- to above-average temperatures were recorded over most of Southeast Asia in October 2025, with the exception of below-average temperatures recorded over Papua (Figure 2). The warmest anomalies (1°C – 2°C above average) were recorded over northern Myanmar, while the coolest anomalies (0.5°C – 1°C below average) were recorded over northern Papua.

era5_temperature_anomalies
Figure 2: Temperature anomalies for October 2025 based on ERA-5 reanalysis. The climatological reference period is 2001-2024. Red colour denotes above-average temperature (warmer), while blue denotes below-average temperature (colder).


2. Climate Drivers

2.1 At the start of October, the Madden-Julian Oscillation (MJO) decayed over the Indian Ocean (Phase 2) and remained inactive in Week 1 and start of Week 2 based on the RMM diagram (Figure 3). An MJO signal then emerged over the Western Hemisphere (Phase 1) towards the end of Week 2, propagating eastwards to the Indian Ocean (Phases 2 and 3) in Week 3 and to the Maritime Continent (Phases 4 and 5) in Week 4. At this time of the year, Phases 1 and 2 tend to bring drier conditions to the eastern Maritime Continent, while Phases 4 and 5 tend to bring wetter conditions to much of the Maritime Continent. However, these patterns are not clear in Figure 1, indicating other drivers and weather systems likely had a stronger influence on the region’s rainfall.

mjo_phase_diagram


Figure 3: The MJO phase diagram. The diagram illustrates the movement of the MJO through different phases, which correspond to different locations along the equator (denoted in the text with the first day of the month in blue and the last day of the month in red). The distance of the index from the centre of the diagram is related to the strength of the MJO. Values within the grey circle are considered weak or indiscernible (data from the Bureau of Meteorology, Australia).


2.2 A negative Indian Ocean Dipole (IOD) was present in October 2025. Negative IOD events tend to bring wetter conditions to parts of the region, particularly the southern Maritime Continent, in line with the positive rainfall anomalies in Figure 1. La Niña conditions were also present. La Niña events tend to bring wetter-than-average conditions to much of the Maritime Continent during this time of the year.


October 17, 2025

Review of Regional Weather for September 2025

Review of Regional Weather for September 2025


1. Overview

1.1 During September 2025, many parts of Southeast Asia experienced above-average rainfall (Figure 1). Most of the Maritime Continent recorded positive (wetter) anomalies in both datasets (GSMaP-NRT and CMORPH-Blended), although CMORH-Blended (Figure 1, right) recorded more extensive negative (drier) anomalies over the northwestern part of the region . Over Mainland Southeast Asia, positive anomalies were recorded over the eastern and central parts of the region. Over the western parts, the two datasets disagree, with GSMaP-NRT recorded mostly above-average rainfall while CMORPH-Blended recorded near-average rainfall over this region. The largest positive (wetter) anomalies over Southeast Asia were recorded over northeastern Mainland Southeast Asia and much of the Philippines.

1.2 The observed rainfall anomaly pattern of above-average rainfall over much of the Maritime Continent is consistent with the predictions from the subseasonal weather outlooks for September 2025 (1 – 14 Sep 2025 and 15 – 28 Aug 2025). The subseasonal weather outlooks also predicted a mix of below-and above-average rainfall over parts of Mainland Southeast Asia, in line with the observations. The observations are also somewhat consistent with the seasonal outlook for September 2025, which predicted an increase in chance of above-normal rainfall in the southern and eastern Maritime Continent.

era5_rainfall_anomalies
cmorph_bld_rainfall_anomalies
Figure 1: Rainfall anomalies for September 2025 based on GSMaP-NRT data (left) and CPC Global Unified Gauge-based Analysis data (right). The climatological reference period is 2001-2024. Green colour denotes above-average rainfall (wetter), while orange denotes below-average rainfall (drier).


1.3 Near- to above-average temperatures were recorded over Mainland Southeast Asia in September 2025, while below- to above-average temperatures were recorded over the Maritime Continent (Figure 2). The coldest anomalies (0.5°C – 1°C below average) were recorded over southern Sumatra and northern Philippines, in line with the above-average rainfall anomalies. The warmest anomalies (0.5°C – 1°C above average) were recorded over parts of northeast and northwest Mainland Southeast Asia, as well as over Sulawesi.

era5_temperature_anomalies
Figure 2: Temperature anomalies for September 2025 based on ERA-5 reanalysis. The climatological reference period is 2001-2024. Red colour denotes above-average temperature (warmer), while blue denotes below-average temperature (colder).


2. Climate Drivers

2.1 At the start of September, the Madden-Julian Oscillation (MJO) was inactive based on the RMM diagram (Figure 3). An MJO signal emerged over the Indian Ocean (Phases 2 and 3) towards the end of the first week of the month, before rapidly decaying in the middle of the second week and then remaining inactive until the end of the month. At this time of the year, Phases 2 and 3 tend to bring drier wetter conditions to the western Maritime Continent. However, these patterns are not visible in Figure 1, indicating other drivers likely had a stronger influence on the region’s rainfall.

mjo_phase_diagram


Figure 3: The MJO phase diagram. The diagram illustrates the movement of the MJO through different phases, which correspond to different locations along the equator (denoted in the text with the first day of the month in blue and the last day of the month in red). The distance of the index from the centre of the diagram is related to the strength of the MJO. Values within the grey circle are considered weak or indiscernible (data from the Bureau of Meteorology, Australia).


2.2 A negative Indian Ocean Dipole (IOD) was present in September 2025. Negative IOD events tend to bring wetter conditions to parts of the region, particularly the southern Maritime Continent, in line with the positive rainfall anomalies in Figure 1.


September 15, 2025

Review of Regional Weather for August 2025

Review of Regional Weather for August 2025


1. Overview

1.1 During August 2025, many parts of Southeast Asia experienced above-average rainfall (Figure 1). Most of the Maritime Continent recorded positive (wetter) anomalies in both datasets (GSMaP-NRT and CMORPH-Blended), although CMORH-Blended (Figure 1, right) recorded negative (drier) anomalies over much of the western Maritime Continent, and parts of Borneo, the southeastern Maritime Continent and northern Philippines. Over Mainland Southeast Asia, positive anomalies were recorded over the east , with a mix of below- to above-average rainfall elsewhere. The largest positive (wetter) anomalies over Southeast Asia were recorded over eastern Mainland Southeast Asia and the southeastern Maritime Continent.

1.2 The observed rainfall anomaly pattern of above-average rainfall over much of the Maritime Continent is consistent with the predictions from the subseasonal weather outlooks for August 2025 (4 – 17 Aug 2025 and 18 – 31 Aug 2025). The subseasonal weather outlooks also predicted a mix of below-and above-average rainfall over parts of Mainland Southeast Asia, in line with the observations. The observations are also somewhat consistent with the seasonal outlook for August 2025, which predicted an increase in chance of above-normal rainfall in the southern and eastern Maritime Continent.

era5_rainfall_anomalies
cmorph_bld_rainfall_anomalies
Figure 1: Rainfall anomalies for August 2025 based on GSMaP-NRT data (left) and CPC Global Unified Gauge-based Analysis data (right). The climatological reference period is 2001-2024. Green colour denotes above-average rainfall (wetter), while orange denotes below-average rainfall (drier).


1.3 Near- to above-average temperatures were recorded over Mainland Southeast Asia in August 2025, while below- to near-average temperatures were recorded over most of the Maritime Continent (Figure 2). The coldest anomalies (0.25°C – 1°C below average) were recorded over Borneo and the southeastern Maritime Continent, in line with the above-average rainfall anomalies. The warmest anomalies (0.5°C – 2°C above average) were recorded over parts of central Mainland Southeast Asia, Sumatra, and Java.

era5_temperature_anomalies
Figure 2: Temperature anomalies for August 2025 based on ERA-5 reanalysis. The climatological reference period is 2001-2024. Red colour denotes above-average temperature (warmer), while blue denotes below-average temperature (colder).


2. Climate Drivers

2.1 At start of August, a Madden-Julian Oscillation (MJO) signal was present in the Western Hemisphere (Phase 8) based on the RMM diagram (Figure 3). This signal propagated eastwards, reaching the Indian Ocean (Phases 2 and 3) by the second week of August. However, as the signal approached the Maritime Continent (Phase 4) in the last week of August, the signal rapidly weakened and became indiscernible. At this time of the year, Phases 8 and 1 tend to bring drier conditions to southern Mainland Southeast Asia and the Philippines, and to a lesser extent, Phases 2 and 3 can bring wetter conditions to the western Maritime Continent. However, these patterns are not visible in Figure 1, indicating other drivers likely had a stronger influence on the region’s rainfall.

mjo_phase_diagram


Figure 3: The MJO phase diagram. The diagram illustrates the movement of the MJO through different phases, which correspond to different locations along the equator (denoted in the text with the first day of the month in blue and the last day of the month in red). The distance of the index from the centre of the diagram is related to the strength of the MJO. Values within the grey circle are considered weak or indiscernible (data from the Bureau of Meteorology, Australia).


2.2 There were signs of a negative Indian Ocean Dipole (IOD) developing in August 2025. Negative IOD events tend to bring wetter conditions to parts of the region, particularly the southern Maritime Continent, in line with the positive rainfall anomalies in Figure 1.


August 21, 2025

Review of Regional Weather for July 2025

Review of Regional Weather for July 2025


1. Overview

1.1 During July 2025, Southeast Asia experienced a mixed of below- to above-average rainfall, with the northwestern and parts of the central Maritime Continent as well as southern Mainland Southeast Asia experiencing below- to near-average rainfall while western and northern Mainland Southeast Asia and northern Philippines experienced above-average rainfall (Figure 1). The largest positive (wetter) anomalies were recorded over northern Philippines. However, there were some disagreements between GSMaP-NRT and CPC Unified Gauge datasets, with CPC Unified Gauge recording more intense below-average rainfall over Borneo and southern Mainland Southeast Asia.

1.2 The observed rainfall anomaly pattern of below-average rainfall over the Maritime Continent and southern Mainland Southeast Asia is mostly consistent with the predictions from the subseasonal weather outlooks for July 2025 (7 – 20 July 2025 and 21 July – 3 August 2025). The subseasonal weather outlooks also predicted the above-average rainfall over parts of Mainland Southeast Asia. The observations are also somewhat consistent with the seasonal outlook for July 2025, although the extent of the predicted region for below-normal rainfall is much smaller than the observed rainfall.

era5_rainfall_anomalies
cmorph_bld_rainfall_anomalies
Figure 1: Rainfall anomalies for July 2025 based on GSMaP-NRT data (left) and CPC Global Unified Gauge-based Analysis data (right). The climatological reference period is 2001-2024. Green colour denotes above-average rainfall (wetter), while orange denotes below-average rainfall (drier).


1.3 Below-average and near-average temperatures were recorded over much of northern Mainland Southeast Asia in July 2025, while above-average temperatures were recorded over most of the Maritime Continent and southern Mainland Southeast Asia (Figure 2). The coldest anomalies (-1°C – -2°C below average) were recorded over central Myanmar while the warmest anomalies (2°C – 3°C above average) were recorded over central Sumatra.

era5_temperature_anomalies
Figure 2: Temperature anomalies for July 2025 based on ERA-5 reanalysis. The climatological reference period is 2001-2024. Red colour denotes above-average temperature (warmer), while blue denotes below-average temperature (colder).


2. Climate Drivers

2.1 There was no discernible Madden-Julian Oscillation (MJO) signal at the start of July based on the RMM diagram (Figure 3). In the middle of Week 2, an MJO signal developed over the Maritime Continent (Phase 4) which then propagated eastwards to the Western Pacific (Phases 6 and 7) by the end of Week 3. The MJO signal continued to propagate through the Western Pacific before decaying at the end of the month. At this time of the year, Phases 4 and 5 tend to bring wetter conditions to parts of the Maritime Continent while Phase 7 tends to bring drier conditions.

mjo_phase_diagram


Figure 3: The MJO phase diagram. The diagram illustrates the movement of the MJO through different phases, which correspond to different locations along the equator (denoted in the text with the first day of the month in blue and the last day of the month in red). The distance of the index from the centre of the diagram is related to the strength of the MJO. Values within the grey circle are considered weak or indiscernible (data from the Bureau of Meteorology, Australia).


2.2 ENSO-neutral conditions were present in July 2025.


July 30, 2025

Review of Regional Weather for June 2025

Review of Regional Weather for June 2025


1. Overview

1.1 During June 2025, Southeast Asia experienced a mixed of below- to above-average rainfall, with parts of the western Maritime Continent experiencing below- to near-average rainfall and above-average rainfall over the southeastern Maritime Continent (Figure 1). The largest positive (wetter) anomalies were recorded over central Viet Nam. However, there were notable disagreements between GSMaP-NRT and CPC Unified Gauge datasets. CPC Unified Gauge recorded more regions with below-average rainfall, in particular over parts of southeastern Mainland Southeast Asia and the central Maritime Continent, where GSMaP-NRT recorded near- to above-average rainfall.

1.2 The observed rainfall anomaly pattern of below-average rainfall over parts of western Mainland Southeast Asia is mostly consistent with the predictions from the subseasonal weather outlooks for June 2025 (26 May – 8 June 2025, 9 – 22 June 2025, and 23 June – 6 July 2025). The subseasonal weather outlooks for the other regions were mixed throughout the June 2025 period and is also reflective in the mixed of below- to above-average rainfall recorded. The observations are also somewhat consistent with the seasonal outlook for June 2025, where below-normal rainfall was predicted for parts of the western Maritime Continent and above-normal rainfall for parts of the southern Maritime Continent.

era5_rainfall_anomalies
cmorph_bld_rainfall_anomalies
Figure 1: Rainfall anomalies for June 2025 based on GSMaP-NRT data (left) and CPC Global Unified Gauge-based Analysis data (right). The climatological reference period is 2001-2024. Green colour denotes above-average rainfall (wetter), while orange denotes below-average rainfall (drier).


1.3 Below-average and near-average temperatures were recorded over much of Mainland Southeast Asia in June 2025, while near-average and above-average temperatures were recorded over most of the Maritime Continent, except over the Philippines and Papua where below-average temperature were recorded (Figure 2). The coldest anomalies (-0.5°C – -1°C below average) were recorded over parts of Cambodia and Viet Nam while the warmest anomalies (1°C – 2°C above average) were recorded over central Sumatra.

era5_temperature_anomalies
Figure 2: Temperature anomalies for June 2025 based on ERA-5 reanalysis. The climatological reference period is 2001-2024. Red colour denotes above-average temperature (warmer), while blue denotes below-average temperature (colder).


2. Climate Drivers

2.1 There was no discernible Madden-Julian Oscillation (MJO) signal for most of June based on the RMM diagram (Figure 3). At the start of the month, the MJO was inactive based on the RMM Index. An MJO signal developed over the Western Pacific in the end of Week 1, propagated eastwards through the Western Pacific (Phases 6 and 7) by the middle of Week 2. The MJO signal decayed over the Western Hemisphere (Phase 8) in Week 3 and remained inactive for the rest of the month. At this time of the year, Phases 7 and 8 tend to bring drier conditions to parts of the Maritime Continent while Phase 4 tends to bring wetter conditions to this region. However, with the MJO being only briefly active during May, the MJO had little effect on the overall recorded rainfall during the month.

mjo_phase_diagram


Figure 3: The MJO phase diagram. The diagram illustrates the movement of the MJO through different phases, which correspond to different locations along the equator (denoted in the text with the first day of the month in blue and the last day of the month in red). The distance of the index from the centre of the diagram is related to the strength of the MJO. Values within the grey circle are considered weak or indiscernible (data from the Bureau of Meteorology, Australia).


2.2 ENSO-neutral conditions were present in June 2025.


June 13, 2025

Review of Regional Weather for May 2025

Review of Regional Weather for May 2025


1. Overview

1.1 During May 2025, much of Southeast Asia experienced above-average rainfall, with parts of the Maritime Continent and southeast Mainland Southeast Asia experiencing below-average rainfall (Figure 1). The largest positive (wetter) anomalies were recorded over western Myanmar, northeastern Borneo, and parts of Papua, with both datasets recording large negative (drier) anomalies over western Borneo. However, there were notable disagreements between GSMaP-NRT and CMORPH-Blended datasets, with CMOPRH. For the northwestern Maritime Continent CMORPH-Blended recorded a mix of above- and below-average rainfall, while GSMaP-NRT recorded below-average rainfall. CMORH-Blended recorded below- to near-average rainfall for Cambodia and northern Lao PDR, while GSMaP-NRT recorded near- to above-average. CMORPH-Blended also has larger negative anomalies over parts of Papua compared to GSMaP-NRT.

1.2 The observed rainfall anomaly pattern of above-average rainfall over much of western Mainland Southeast Asia and the southern Maritime Continent and drier conditions over parts of the western and central equatorial region is mostly consistent with the predictions from the subseasonal weather outlooks for May 2025 (28 April – 11 May 2025, 12 – 25 May 2025, and 26 May – 8 June 2025). The observations are also somewhat consistent with the seasonal outlook for May, above-normal rainfall was predicted for much of the eastern Maritime Continent and near- to above-normal rainfall for parts of Mainland Southeast Asia

era5_rainfall_anomalies
cmorph_bld_rainfall_anomalies
Figure 1: Rainfall anomalies for May 2025 based on GSMaP-NRT data (left) and CMORPH-Blended data (right). The climatological reference period is 2001-2024. Green colour denotes above-average rainfall (wetter), while orange denotes below-average rainfall (drier).


1.3 Below-average and near-average temperatures were recorded over much of Mainland Southeast Asia in May 2025, while near-average and above-average temperatures were recorded over most of the Maritime Continent (Figure 2). The coldest anomalies (-1°C – -2°C below average) were recorded over parts of western and central Myanmar, associated with regions of above-average rainfall. The warmest anomalies (0.5°C – 1°C above average) were recorded over southern Sumatra.

era5_temperature_anomalies
Figure 2: Temperature anomalies for May 2025 based on ERA-5 reanalysis. The climatological reference period is 2001-2024. Red colour denotes above-average temperature (warmer), while blue denotes below-average temperature (colder).


2. Climate Drivers

2.1 There was no discernible Madden-Julian Oscillation (MJO) signal for most of May based on the RMM diagram (Figure 3). At the start of the month, there were signs of an MJO signal over the Western Hemisphere (Phase 8) but it became inactive by the end of the first week. In the last week of the May, the signal briefly emerged in Phase 4 for two days before staying inactive until the end of the month. At this time of the year, Phase 8 tend to bring drier conditions to parts of the Maritime Continent while Phase 4 tends to bring wetter conditions to this region. However, with the MJO being only briefly active during May, the MJO had little effect on the overall recorded rainfall during the month.

mjo_phase_diagram


Figure 3: The MJO phase diagram. The diagram illustrates the movement of the MJO through different phases, which correspond to different locations along the equator (denoted in the text with the first day of the month in blue and the last day of the month in red). The distance of the index from the centre of the diagram is related to the strength of the MJO. Values within the grey circle are considered weak or indiscernible (data from the Bureau of Meteorology, Australia).


2.2 ENSO-neutral conditions were present in May 2025.


May 16, 2025

Review of Regional Weather for April 2025

Review of Regional Weather for April 2025


1. Overview

1.1 During April 2025, much of the western Maritime Continent and western Mainland Southeast Asia experienced above-average rainfall, while much of the southern and northeastern Maritime Continent experienced below-average rainfall (Figure 1). The largest positive (wetter) anomalies were recorded over the Malay Peninsula. Outside of the regions mentioned above, there was either disagreements between GSMaP-NRT and CMORPH-Blended datasets or no notable anomalies. For much of the central and eastern equatorial region CMORPH-Blended recorded below-average rainfall, while GSMaP-NRT recorded above-average rainfall. CMORH-Blended also recorded below-average rainfall for Cambodia, while GSMaP-NRT was near-average.

1.2 The observed rainfall anomaly pattern of above-average rainfall over much of western Mainland Southeast Asia and the western Maritime Continent and drier conditions over the northeastern Maritime continent is consistent with the predictions from the subseasonal weather outlooks for April 2025 (31 March – 13 April 2025, and 14 – 27 April 2025). The observed pattern is also partly consistent with the April 2025 seasonal outlook of above-normal rainfall over western Mainland Southeast Asia, although the northwestern Maritime Continent was predicted to have a higher chance of above-normal rainfall.

era5_rainfall_anomalies
cmorph_bld_rainfall_anomalies
Figure 1: Rainfall anomalies for April 2025 based on GSMaP-NRT data (left) and CMORPH-Blended data (right). The climatological reference period is 2001-2024. Green colour denotes above-average rainfall (wetter), while orange denotes below-average rainfall (drier).


1.3 Below-average and near-average temperatures were recorded over most of Southeast Asia in April 2025, apart from over northern Myanmar and the Philippines (Figure 2). The coldest anomalies (-1°C – -2°C below average) were recorded over parts of western and southern Myanmar, associated with regions of above-average rainfall. The warmest anomalies (1°C – 2°C above average) were recorded over northern Myanmar.

era5_temperature_anomalies
Figure 2: Temperature anomalies for April 2025 based on ERA-5 reanalysis. The climatological reference period is 2001-2024. Red colour denotes above-average temperature (warmer), while blue denotes below-average temperature (colder).


2. Climate Drivers

2.1 There was no discernible Madden-Julian Oscillation (MJO) signal for most of April based on the RMM diagram (Figure 3). During the last week of April, there were signs of an MJO signal over the Western Pacific (Phases 6 and 7) and the Western Hemisphere (Phase 8). Phases 6 and 8 tend to bring drier conditions to parts of the Maritime Continent at this time of the year, although this is not noticeable in the April rainfall anomalies, particularly for GSMaP-NRT.

mjo_phase_diagram


Figure 3: The MJO phase diagram. The diagram illustrates the movement of the MJO through different phases, which correspond to different locations along the equator (denoted in the text with the first day of the month in blue and the last day of the month in red). The distance of the index from the centre of the diagram is related to the strength of the MJO. Values within the grey circle are considered weak or indiscernible (data from the Bureau of Meteorology, Australia).


2.2 ENSO-neutral conditions were present in April 2025. Sea surface temperatures in the Nino3.4 region (used to monitor ENSO) indicated a return to ENSO-neutral. Key atmospheric indicators of La Niña (reduced cloudiness and stronger trade winds in the central Pacific) were present earlier in March, but have since shown signs of weakening, in line with a transition to ENSO-neutral conditions.


April 28, 2025

Review of Regional Weather for March 2025

Review of Regional Weather for March 2025


1. Overview

1.1 During March 2025, much of the Maritime Continent experienced above-average rainfall, except parts of the Philippines, the Malay Peninsula and the eastern Maritime Continent which experienced below-average rainfall (Figure 1). For Mainland Southeast Asia, below-average rainfall was recorded over parts of northeastern and southern region, with near average elsewhere. The largest positive (wetter) anomalies were recorded around the eastern coast of Sumatra to the southern tip of Malay Peninsula, while the largest negative (drier) anomalies were recorded over the northwestern Maritime Continent. There were disagreements between GSMaP-NRT and CMORPH-Blended datasets on the extent and magnitude of the dry anomalies, in particular over northern Lao PDR, northern Vietnam, parts of southern Philippines, southern Sumatra, Java and southeast Borneo, and Papua, with CMORPH-Blended showing stronger and more extensive dry anomalies as compared to GSMaP-NRT.

1.2 The observed rainfall anomaly pattern of above-average rainfall over much of the Maritime Continent is consistent with the predictions from the subseasonal weather outlooks for March 2025 (3 – 16 March 2025, and 17 – 30 March 2025). The observed pattern of above-average rainfall over the Maritime Continent is also consistent with the March 2025 seasonal outlook, although the below-normal rainfall over parts of the Maritime Continent is not well represented.

era5_rainfall_anomalies
cmorph_bld_rainfall_anomalies
Figure 1: Rainfall anomalies for March 2025 based on GSMaP-NRT data (left) and CMORPH-Blended data (right). The climatological reference period is 2001-2024. Green colour denotes above-average rainfall (wetter), while orange denotes below-average rainfall (drier).


1.3 A mix of normal and below-average temperatures were recorded over eastern half of Mainland Southeast Asia whereas above-average temperatures were recorded over the western half of Mainland Southeast Asia in March 2025 (Figure 2). Elsewhere, above-average temperature were recorded over much of the Maritime Continent, except over the northwestern region with below- to near-average temperature. The coldest anomalies (-1°C – -2°C below average) were recorded over parts of central Vietnam and northeastern Thailand, while the warmest anomalies (1°C – 2°C above average) were recorded over western Myanmar.

era5_temperature_anomalies
Figure 2: Temperature anomalies for March 2025 based on ERA-5 reanalysis. The climatological reference period is 2001-2024. Red colour denotes above-average temperature (warmer), while blue denotes below-average temperature (colder).


2. Climate Drivers

2.1 In the first week of March, an active Madden-Julian Oscillation (MJO) signal was observed over the Western Hemisphere (Phase 1). In the second week of the month, the signal propagated eastwards through the Indian Ocean (Phases 2 and 3) and continued its eastwards propagation over the Maritime Continent (Phase 4) in the third week. The signal weakened towards the end of third week of March over the Maritime Continent and became indiscernible in the last week of the month. During this time of the year, Phase 1 typically bring drier conditions to the Maritime Continent. Phase 2 and 3 tend to bring wetter conditions over the western Maritime Continent, while Phases 4 and 5 typically bring wetter conditions over much of the Maritime Continent. This observed MJO signal during March is in line with the above-normal rainfall anomalies in Figure 1.

mjo_phase_diagram


Figure 3: The MJO phase diagram. The diagram illustrates the movement of the MJO through different phases, which correspond to different locations along the equator (denoted in the text with the first day of the month in blue and the last day of the month in red). The distance of the index from the centre of the diagram is related to the strength of the MJO. Values within the grey circle are considered weak or indiscernible (data from the Bureau of Meteorology, Australia).


2.2 In March 2025, La Niña conditions were present. Sea surface temperatures in the Nino3.4 region (used to monitor ENSO) indicated La Niña conditions and atmospheric indicators (cloudiness and trade winds) also showed signs of La Niña. La Niña events tend to bring wetter-than-average conditions to much of the Maritime Continent during this time of the year.