Review of Regional Weather for June 2024
1. Overview
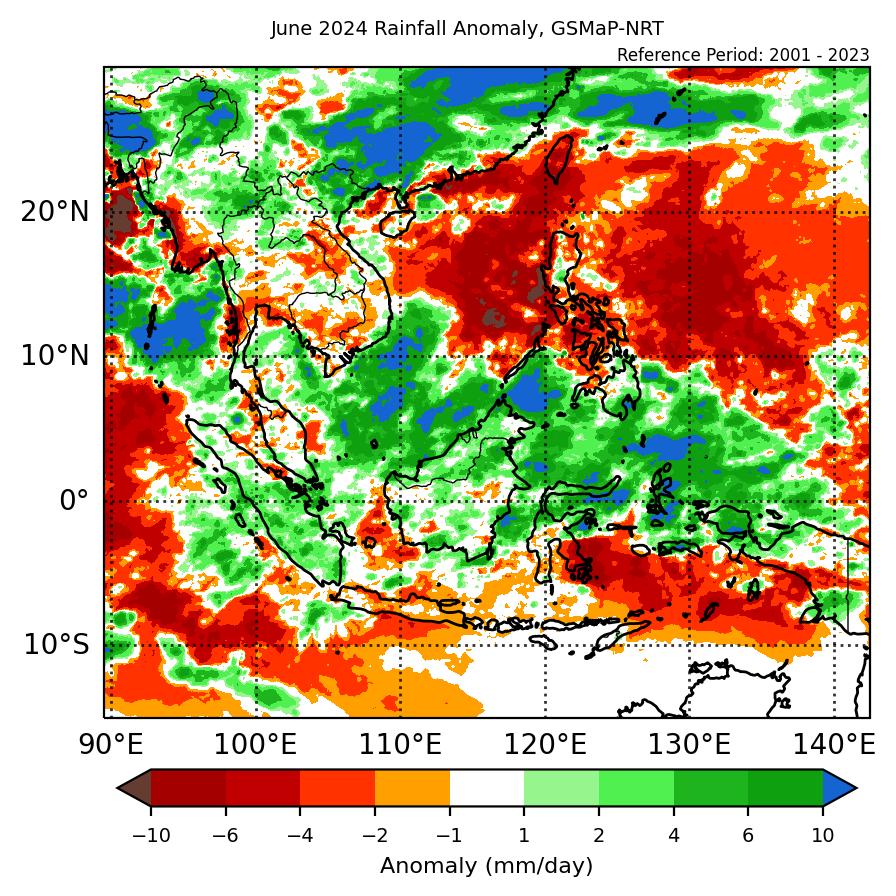
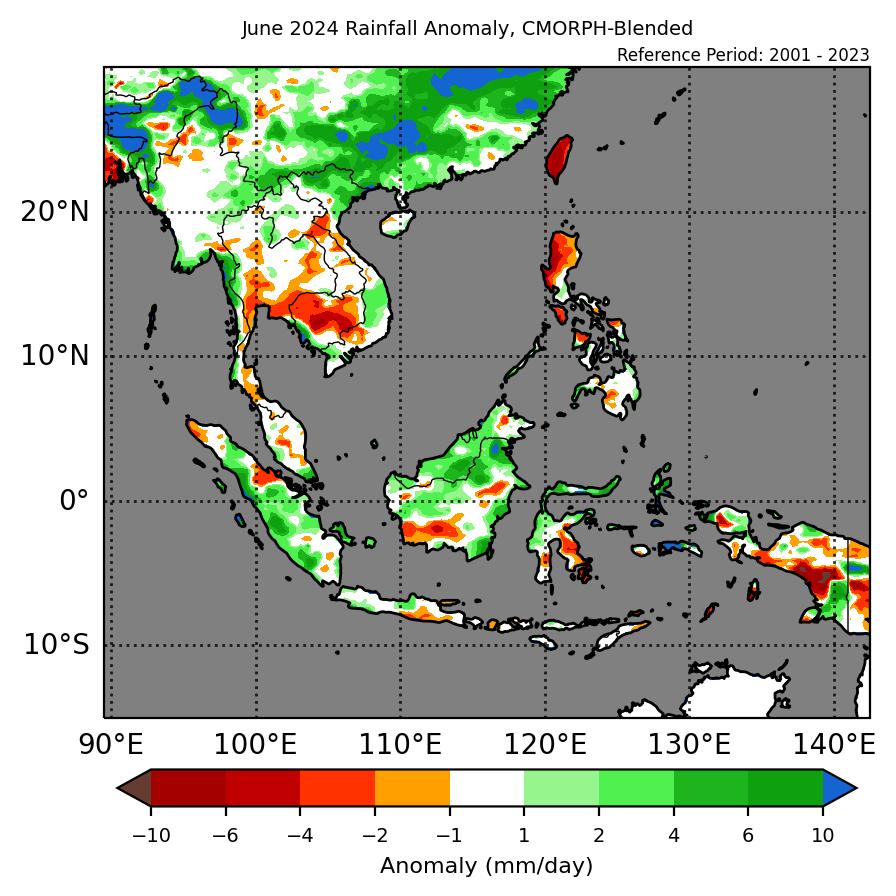
1.1 During June 2024, much of northern half of Mainland Southeast Asia and the equatorial region experienced near- to above-average rainfall, while much of the southern half of Mainland Southeast Asia, southern parts of the Maritime Continent and most of the Philippines experienced near- to below-average rainfall (Figure 1). The largest negative (drier) anomalies were recorded over the central Philippines in GSMap-NRT (Figure 1, left) and over Cambodia in CMORPH-Blended (Figure 1, right). The larger positive (wetter) anomalies were recorded over northern Myanmar and northeastern Borneo (in both GSMap-NRT and CMORPH-Blended).
1.2 The observed rainfall anomaly pattern of a mix of below- and above-average rainfall over the northern ASEAN region is consistent with the predictions from the subseasonal weather outlooks for June 2024 (27 May – 9 June 2024 , 10 – 23 June 2024 and 24 June – 7 July 2024).
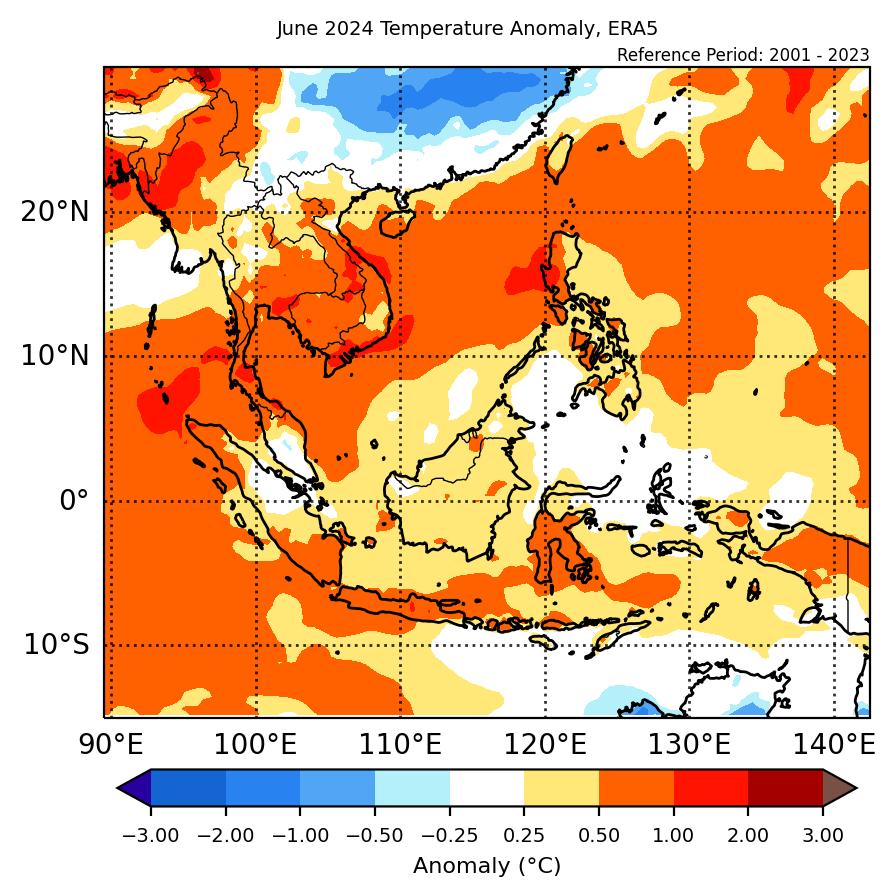
1.3 Above-average temperatures were recorded over much of the ASEAN region in June 2024 (Figure 2), with pockets of near-average temperature over parts of the region. The warmest anomalies (between 1 to 2°C above average) were recorded over western Myanmar as well as in smaller areas scattered over the northern Philippines and southeastern parts of Mainland Southeast Asia.
2. Climate Drivers
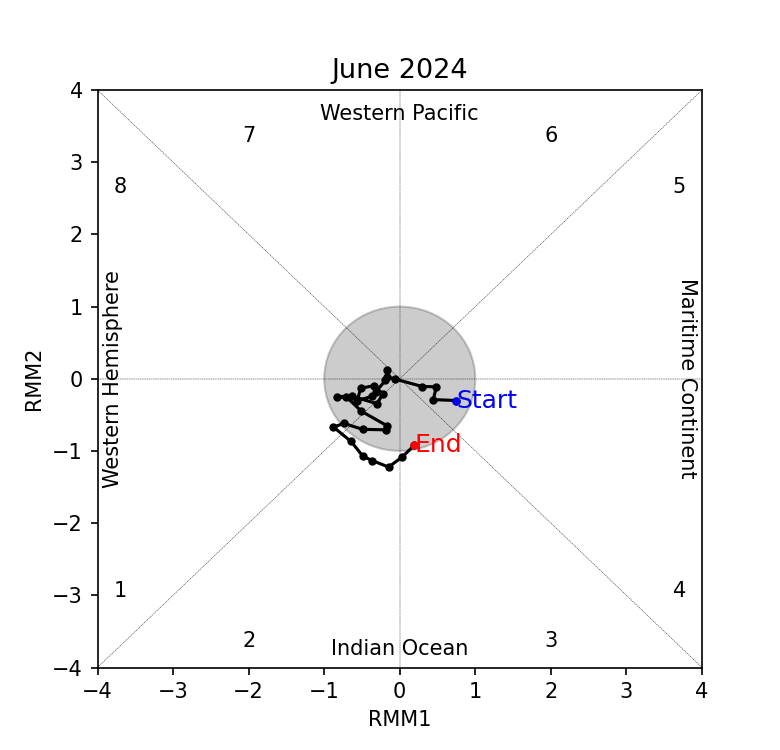
2.1 The Madden-Julian Oscillation (MJO) was inactive for much of June 2024, based on the RMM index (Figure 3). There was no active MJO signal for the first three weeks of June. An MJO signal developed in the Western Hemisphere and Africa (Phase 1) in the last week of June. The MJO signal remained weak as it propagated eastwards over the Indian Ocean (Phases 2 and 3), before becoming inactive again (at Phase 3) at the end of the month. For June, Phases 2 and 3 tend to bring wetter conditions to parts of the Maritime Continent (the western Maritime Continent in Phase 2, much of the region for Phase 3).
2.2 The El Niño event has ended, although the lingering effect of the El Niño still likely contributed to the warmer temperatures observed in Figure 2.


