Review of Regional Weather for December 2020
1. Overview
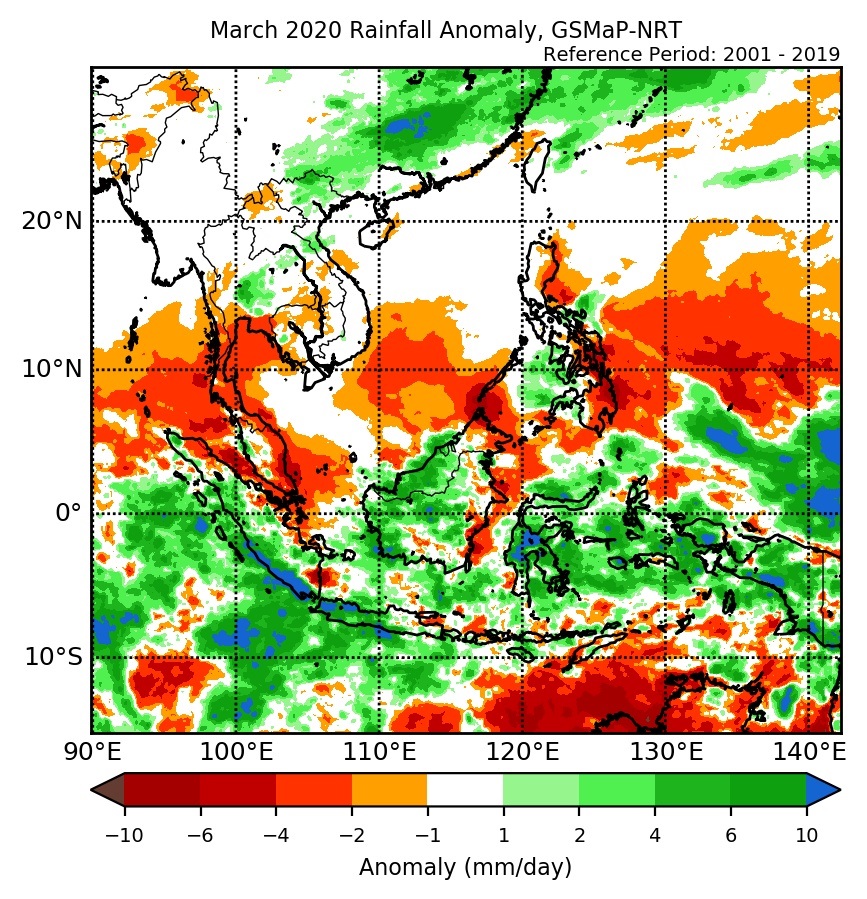
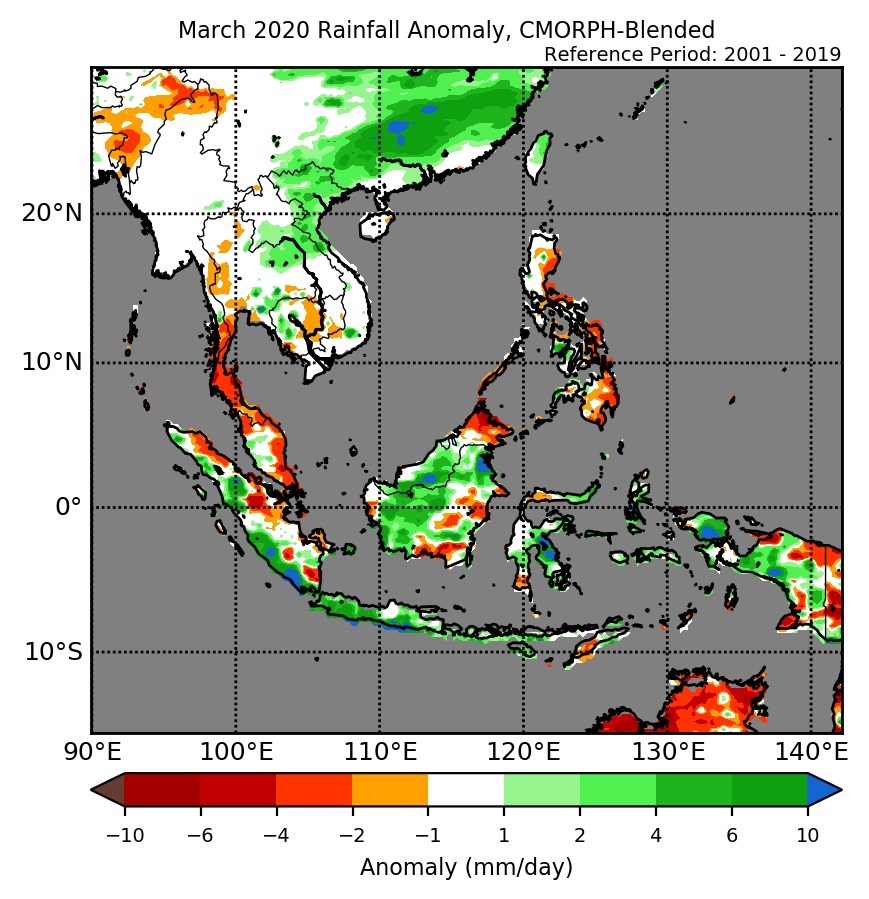
1.1 During December 2020, coastal south-eastern parts of Mainland Southeast Asia and the Philippines experienced above-average rainfall (Figure 1). The largest positive anomalies (wetter conditions) were recorded over northern and central Philippines, and southern Thailand based on both satellite-derived rainfall estimates datasets (GSMaP-NRT and CMORPH-Blended), partly linked to the tropical storm Krovanh in Week 3. For the rest of Mainland Southeast Asia, rainfall anomalies were negligible, expected at the start of dry season for the northern ASEAN region. A mix of above- and below-average rainfall was experienced for most regions in the equatorial region. There is some discrepancy between the two satellite datasets for the below-average rainfall for southern and central parts of Borneo, with more extensive drier conditions based on CMORPH-Blended (Figure 1, right) compared to GSMaP-NRT (Figure 1, left). Elsewhere in the southern Maritime Continent, wetter-than-average rainfall conditions were recorded over much of the land masses.
1.2 The observed large-scale rainfall anomaly pattern (i.e. above-average rainfall in regions linked to tropical storm and cyclone activity and below-average rainfall over parts of equatorial region) is broadly consistent with the predictions from the subseasonal weather outlooks for December 2020 (30 Nov – 13 Dec, 14 – 27 Dec).


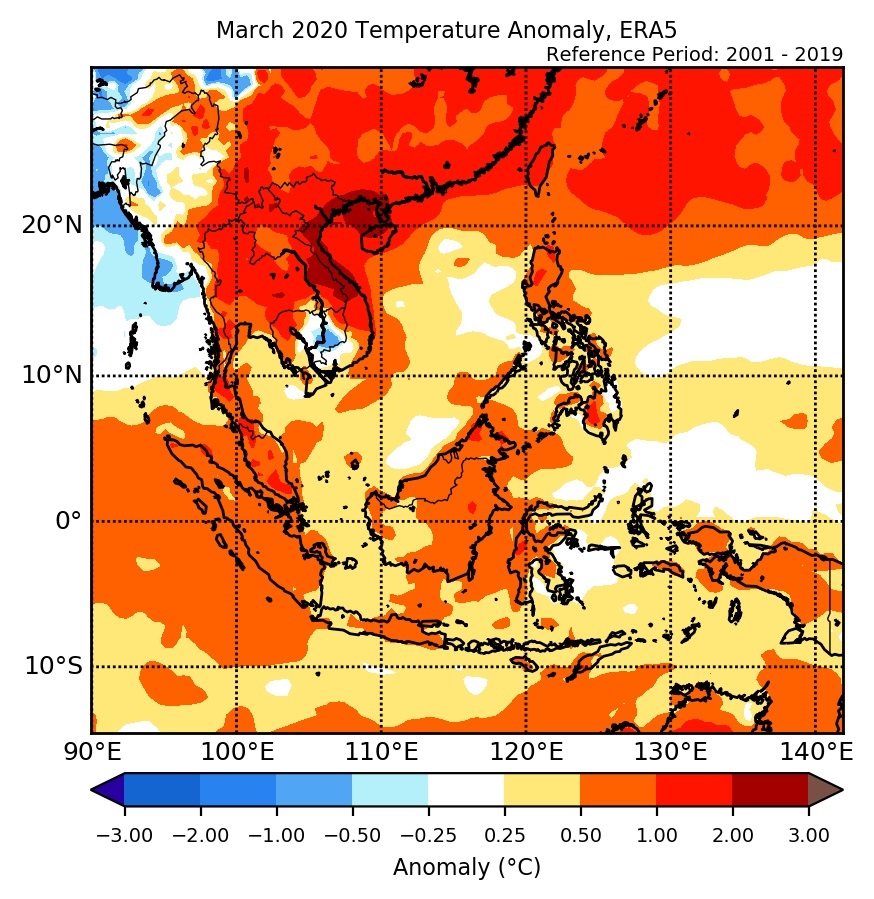
1.3 Colder-than-average temperatures were recorded over some regions of the eastern half of Mainland Southeast Asia in December 2020 (Figure 2). In contrast, warmer-than-average temperatures (more than 1°C warmer) were recorded over parts of Myanmar and northern Philippines. Warmer-than-average temperatures were also recorded over much of the equatorial region (3°S to 2°N). Elsewhere, the temperature for December was closer to average.

2. Climate Drivers
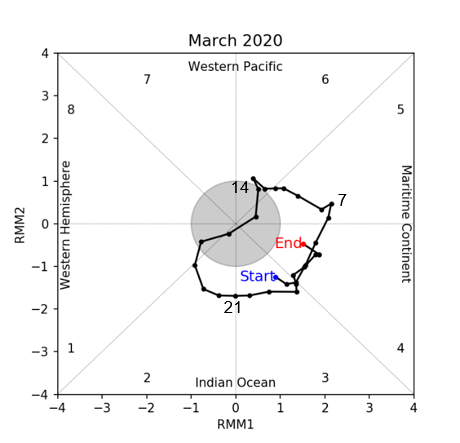
2.1 A weak and slow-moving Madden-Julian Oscillation (MJO) signal was present in the Maritime Continent (Figure 3, Phase 5) at the start of December 2020, momentarily strengthened in Week 2 and then weakened as it reached Western Pacific (Phase 6) in the second half of December 2020. Phase 5 typically brings wetter conditions to eastern half of the Southeast Asia (observed in the rainfall anomalies for December 2020, Figure 1).

2.2 Over the tropical Pacific Ocean, La Niña conditions were present. The sea surface temperatures in the central and eastern Pacific Ocean remained cool, with atmospheric indicators (cloudiness and wind anomalies) also remaining consistent with La Niña conditions. La Niña events tend to bring wetter-than-average conditions to much of Southeast Asia during the September to December period.