Category Archives: Regional Weather Review for Year 2021

January 13, 2022

Review of Regional Weather for December 2021

Review of Regional Weather for December 2021


1. Overview

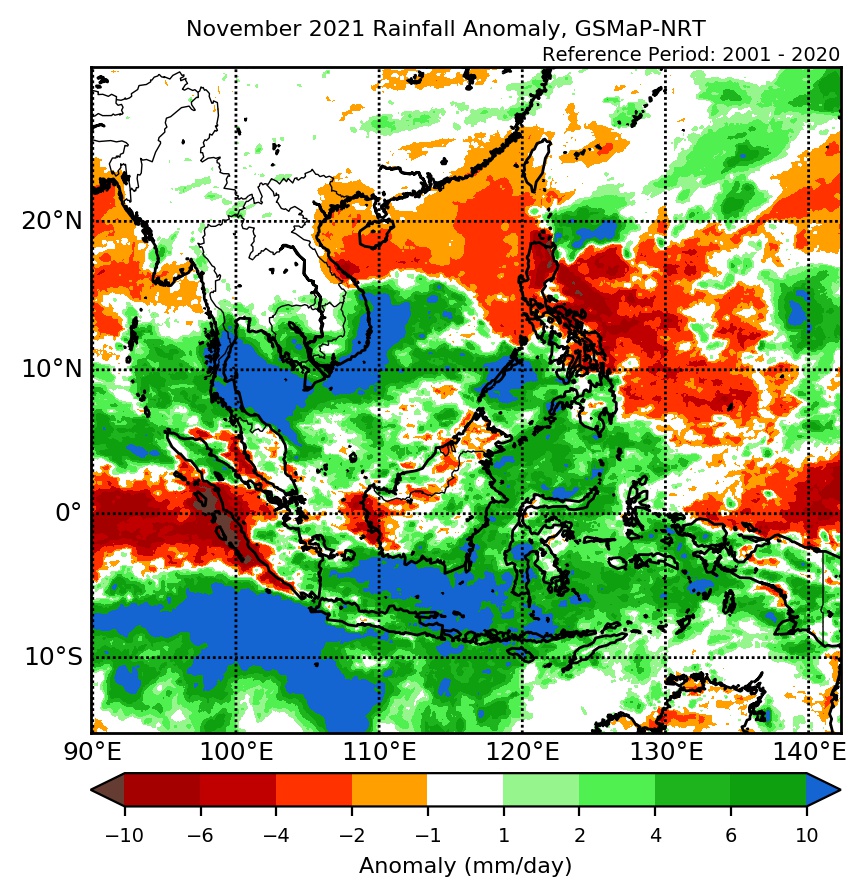
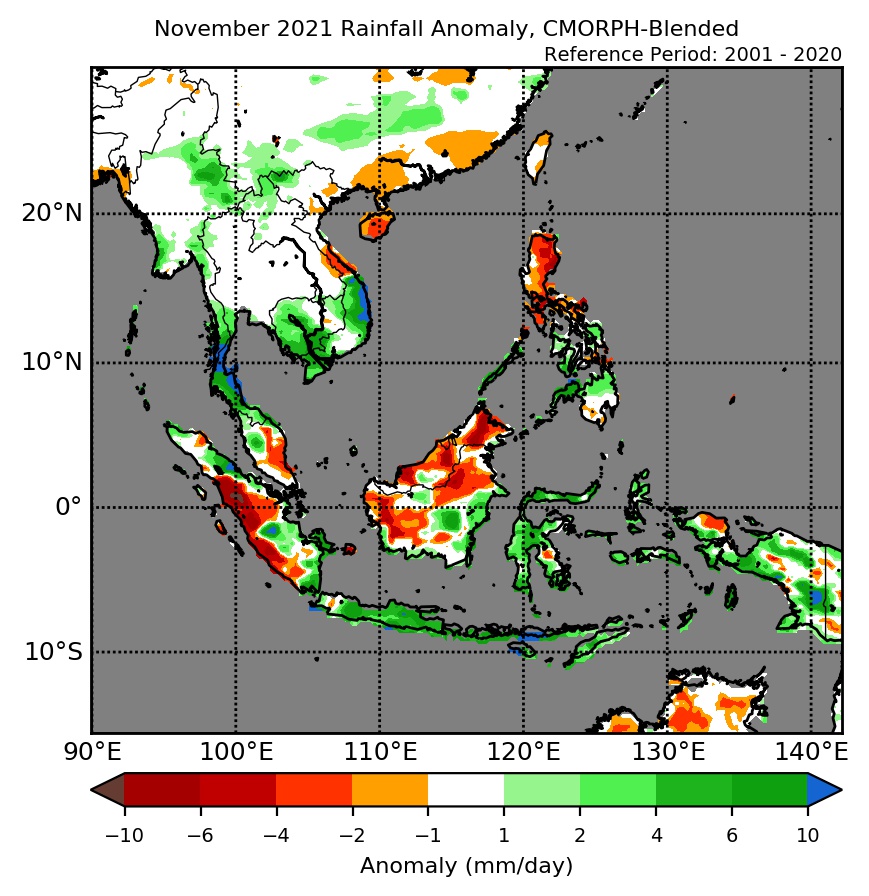
1.1 During December 2021, coastal central parts of Viet Nam, Peninsular Malaysia and southern half of the Philippines experienced above-average rainfall (Figure 1). The largest positive anomalies (wetter conditions) were recorded over the central Philippines and the Peninsular Malaysia (due to Super Typhoon Rai and Tropical Depression 29W respectively, which made landfall in mid-December), for both satellite-derived rainfall estimates datasets (GSMaP-NRT and CMORPH-Blended). For the rest of the Mainland Southeast Asia, rainfall anomalies were negligible, as expected at the start of dry season for the northern ASEAN region. A mix of above- and below-average rainfall was experienced for most regions in the equatorial region. There is some discrepancy between the two satellite datasets for the below-average rainfall for central parts of Borneo, with more extensive drier conditions based on CMORPH-Blended (Figure 1, right) compared to near- to above-average rainfall for GSMaP-NRT (Figure 1, left). Elsewhere in the southern Maritime Continent, wetter-than-average rainfall conditions were recorded over much of the land masses.

1.2 The observed large-scale rainfall anomaly pattern (i.e. above-average rainfall in regions linked to tropical storm and cyclone activity and below-average rainfall over parts of equatorial region) is broadly consistent with the predictions from the subseasonal weather outlooks for December 2021 (29 November – 12 December, 13 – 26 December, and 27 December – 9 January), apart from the positive anomalies (wetter conditions) for Peninsular Malaysia not highlighted in the outlooks.

era5_rainfall_anomalies
cmorph_bld_rainfall_anomalies
Figure 1: Rainfall anomalies for the month of December 2021 based on GSMaP-NRT data (left) and CMORPH-Blended data (right). The climatological reference period is 2001-2020. Green colour denotes above-average rainfall (wetter), while orange denotes below-average rainfall (drier).


1.3 Below-average temperatures were recorded over central and eastern regions of Mainland Southeast Asia in December 2021 (Figure 2). In contrast, above-average temperatures (more than 1°C warmer) were recorded over parts of Myanmar. Elsewhere, near- to slightly above-average temperature were recorded.

era5_temperature_anomalies


Figure 2: Temperature anomalies for the month of December 2021 based on ERA-5 reanalysis. The climatological reference period is 2001-2020. Red colour denotes above-average temperature (warmer), while blue denotes below-average temperature (colder).


2. Climate Drivers

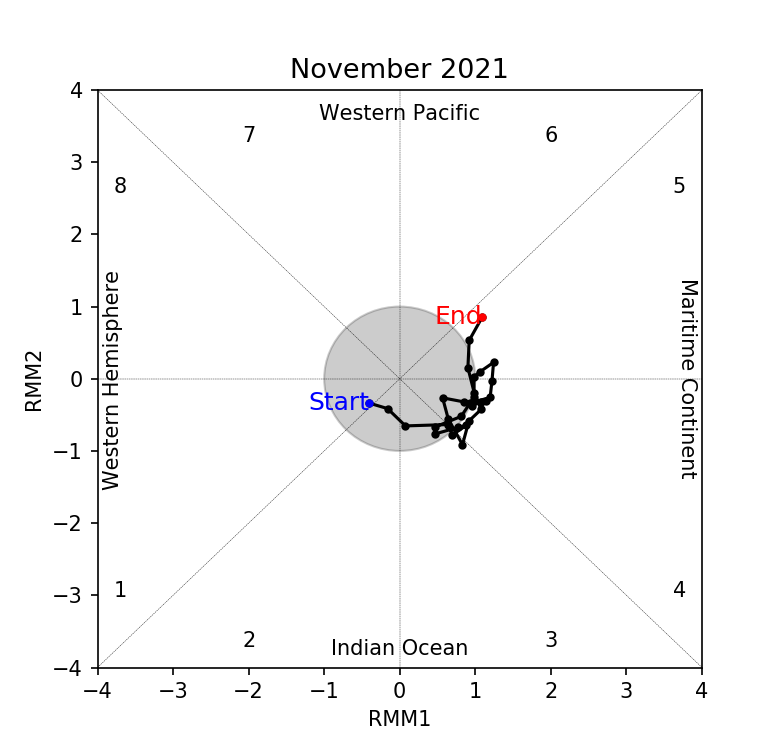
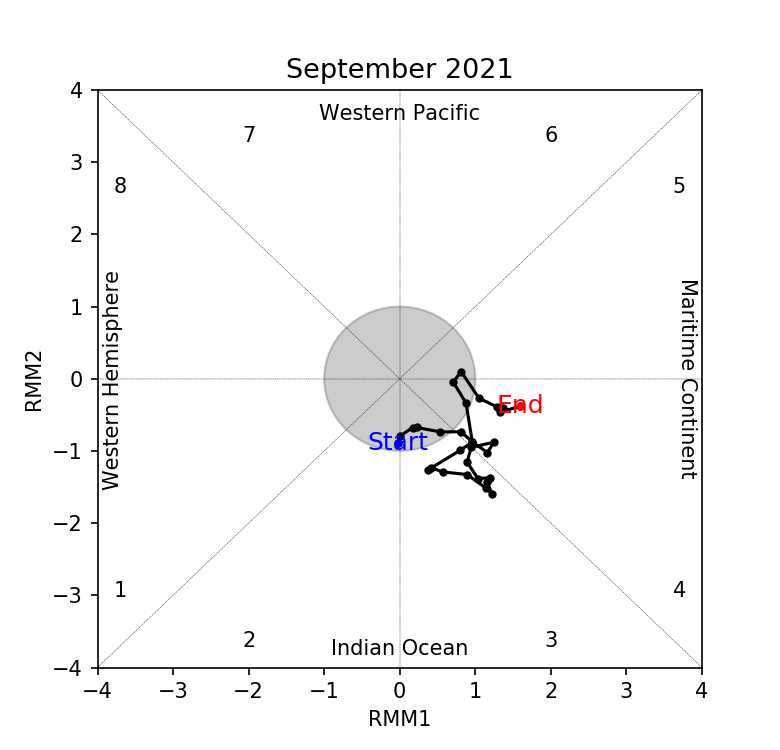
2.1 A Madden-Julian Oscillation (MJO) was present over the Western Pacific (Phase 6) at the start of December 2021, based on the MJO phase diagram below (Figure 3). From second week of December onwards, this signal was not very coherent (very slow eastwards propagation towards Phase 7) and likely influenced by the background La Niña conditions. Phase 6 tends to bring wetter conditions to eastern Maritime Continent, while Phase 7 tends to bring drier conditions to the western Maritime Continent at this time of the year.

mjo_phase_diagram


Figure 3: The MJO phase diagram. The diagram illustrates the movement of the MJO through different phases, which correspond to different locations along the equator (denoted in the text with the first day of the month in blue and the last day of the month in red). The distance of the index from the centre of the diagram is related to the strength of the MJO. Values within the grey circle are considered weak or indiscernible (data from the Bureau of Meteorology, Australia).


2.2 Over the tropical Pacific Ocean, La Niña conditions were present. Sea surface temperatures in the Nino3.4 region (used to monitor ENSO) and the atmospheric indicators over the tropical Pacific Ocean were consistent with La Niña conditions. La Niña events tend to bring wetter-than-average conditions to much of the Maritime Continent during the December to February period.

December 14, 2021

Review of Regional Weather for November 2021

Review of Regional Weather for November 2021


1. Overview

1.1 During November 2021, a mix of below- to above-average rainfall was recorded over the Maritime Continent, while near-average rainfall was recorded over much of Mainland Southeast Asia, except for above-average rainfall recorded over southern Mainland Southeast Asia (Figure 1). The largest positive anomalies (wetter conditions) were recorded over southern Mainland Southeast Asia for both satellite-derived rainfall estimates datasets (GSMaP-NRT and CMORPH-Blended). The largest negative anomalies (drier conditions) were recorded over central Sumatra and the Philippines, with larger negative anomalies based on CMORPH-Blended data compared to GSMaP-NRT.

1.2 The observed rainfall anomaly pattern of a mix of below- to above-average rainfall for the Maritime Continent and the above-average rainfall for southern Mainland Southeast Asia are broadly consistent with the predictions from the subseasonal weather outlooks for November 2021 (1 – 14 November and 15 – 28 November).

era5_rainfall_anomalies
cmorph_bld_rainfall_anomalies
Figure 1: Rainfall anomalies for the month of November 2021 based on GSMaP-NRT data (left) and CMORPH-Blended data (right). The climatological reference period is 2001-2020. Green colour denotes above-average rainfall (wetter), while orange denotes below-average rainfall (drier).


1.3 Above average temperature was recorded over western Mainland Southeast Asia, the western Maritime Continent, as well as the northern Philippines and eastern Indonesia. Below-average temperature was recorded over northeastern Mainland southeast Asia and southern Indonesia (Figure 2). Elsewhere, near-average temperature was recorded. The largest positive anomalies (warmer temperatures) were over western Myanmar, and largest negative anomalies (cooler temperatures) were over northern Viet Nam and eastern Java.

era5_temperature_anomalies


Figure 2: Temperature anomalies for the month of November 2021 based on ERA-5 reanalysis. The climatological reference period is 2001-2020. Red colour denotes above-average temperature (warmer), while blue denotes below-average temperature (colder).


2. Climate Drivers

2.1 There was no Madden-Julian Oscillation (MJO, Figure 3) present at the start of November 2021, based on the MJO phase diagram below. From second week of November onwards, there were signs of a MJO signal over the Maritime Continent (Phases 4 and 5). However, this signal was not very coherent and likely influenced by the background La Niña conditions. Phases 4 and 5 tend to bring wetter conditions to parts of the ASEAN region around 10°N, while Phase 5 tends to bring drier conditions to the western Maritime Continent.

mjo_phase_diagram


Figure 3: The MJO phase diagram. The diagram illustrates the movement of the MJO through different phases, which correspond to different locations along the equator (denoted in the text with the first day of the month in blue and the last day of the month in red). The distance of the index from the centre of the diagram is related to the strength of the MJO. Values within the grey circle are considered weak or indiscernible (data from the Bureau of Meteorology, Australia).


2.2 La Niña conditions were present over the tropical Pacific. Sea surface temperatures in the Nino3.4 region (used to monitor ENSO) and the atmospheric indicators over the tropical Pacific Ocean were consistent with La Niña conditions. La Niña events tend to bring wetter-than-average conditions to much of Southeast Asia during the September to November period.

November 16, 2021

Review of Regional Weather for October 2021

Review of Regional Weather for October 2021

1. Overview

1.1 During October 2021, above-average rainfall was recorded over much of the northern ASEAN region, while a mix of below- to above-average rainfall was recorded over the southern ASEAN region (Figure 1). For the northern ASEAN region, above-average rainfall was recorded apart from over central and northern Myanmar and parts of the Philippines. The largest positive anomalies (wetter conditions) were recorded over eastern Mainland Southeast Asia for both satellite-derived rainfall estimates datasets (GSMaP-NRT and CMORPH-Blended), which was associated with Severe Tropical Storm Kompasu. A second tropical storm, Tropical Storm Lionrock, crossed the central Philippines at the start of October, contributing to the large positive anomalies in the ocean region around the Philippines (GSMaP-NRT). For the southern ASEAN region, negative anomalies (drier conditions) were recorded over western parts as well as northern Borneo, although the negative anomalies were larger based on CMORPH-Blended data compared to GSMaP-NRT. Elsewhere in the southern ASEAN region, rainfall tended to be near-to above-average during October 2021.

1.2 The observed rainfall anomaly pattern of above-average rainfall for much of the northern ASEAN region and a mix of below- to above-average rainfall for the southern ASEAN region is broadly consistent with the predictions from the subseasonal weather outlooks for October 2021 (4 – 17 October and 18 – 31 October).

era5_rainfall_anomalies
cmorph_bld_rainfall_anomalies
Figure 1: Rainfall anomalies for the month of October 2021 based on GSMaP-NRT data (left) and CMORPH-Blended data (right). The climatological reference period is 2001-2020. Green colour denotes above-average rainfall (wetter), while orange denotes below-average rainfall (drier).


1.3 Most of the ASEAN region experienced near to above-average temperatures during October 2021 (Figure 2). The exception was over eastern parts of Mainland Southeast Asia, which experienced below- to near-average temperatures. The largest positive anomalies (warmer temperatures) were over northern Myanmar and the western Maritime Continent where negative rainfall anomalies (drier conditions) were also recorded.

era5_temperature_anomalies


Figure 2: Temperature anomalies for the month of October 2021 based on ERA-5 reanalysis. The climatological reference period is 2001-2020. Red colour denotes above-average temperature (warmer), while blue denotes below-average temperature (colder).


2. Climate Drivers

2.1 The Madden-Julian Oscillation (MJO, Figure 3) signal was present over the Maritime Continent at the start of October 2021 (Phases 4 and 5). However, this signal weakened rapidly as it approached the Western Pacific (Phase 6) likely influenced by the background La Niña conditions. For the rest of October, there was no discernible MJO signal, based on the MJO phase diagram below. Phases 4 and 5 tend to bring wetter conditions to parts of the ASEAN region around 10°N, while Phase 5 tends to bring drier conditions to the western Maritime Continent.

mjo_phase_diagram


Figure 3: The MJO phase diagram. The diagram illustrates the movement of the MJO through different phases, which correspond to different locations along the equator (denoted in the text with the first day of the month in blue and the last day of the month in red). The distance of the index from the centre of the diagram is related to the strength of the MJO. Values within the grey circle are considered weak or indiscernible (data from the Bureau of Meteorology, Australia).


2.2 By the end of October 2021, La Niña conditions were present in the tropical Pacific. Sea surface temperatures in the Nino3.4 region (used to monitor ENSO) continued to cool, with some signs of La Niña conditions in the atmosphere. A weak negative Indian Ocean Dipole (IOD) was present and at the seasonal timescale, negative IOD events tend to bring wetter conditions to the southern Maritime Continent.

October 13, 2021

Review of Regional Weather for September 2021

Review of Regional Weather for September 2021

1. Overview

1.1 During September 2021, there was above-average rainfall recorded over much of the ASEAN region (Figure 1). The exceptions were northern Sumatra and northern Philippines, and also parts of northern Myanmar, Peninsular Malaysia, Borneo, and Papua, which received a mix of below- to near-average rainfall. The largest positive anomalies (wetter conditions) were recorded over eastern Mainland Southeast Asia (due to Tropical Storm Conson and Tropical Storm Dianmu which made landfall in early-September and late-September respectively) and southern Myanmar for both satellite-derived rainfall estimates datasets (GSMaP-NRT and CMORPH-Blended), with GSMaP-NRT also recording larger anomalies over eastern Borneo, northern and eastern Sulawesi, and Maluku Islands.

1.2 The observed rainfall anomaly pattern of above-average rainfall for much of the ASEAN region is broadly consistent with the predictions from the subseasonal weather outlooks for September 2021 (23 August – 5 September, 6 – 19 September and 20 September – 3 October).

era5_rainfall_anomalies
cmorph_bld_rainfall_anomalies
Figure 1: Rainfall anomalies for the month of September 2021 based on GSMaP-NRT data (left) and CMORPH-Blended data (right). The climatological reference period is 2001-2020. Green colour denotes above-average rainfall (wetter), while orange denotes below-average rainfall (drier).


1.3 Most of the ASEAN region experienced below to near-average temperatures during September 2021 (Figure 2), in line with the wetter conditions recorded. The exceptions were warmer-than-average temperatures recorded over the southeastern Maritime Continent and northern Myanmar.

era5_temperature_anomalies


Figure 2: Temperature anomalies for the month of September 2021 based on ERA-5 reanalysis. The climatological reference period is 2001-2020. Red colour denotes above-average temperature (warmer), while blue denotes below-average temperature (colder).


2. Climate Drivers

2.1 The Madden-Julian Oscillation (MJO, Figure 3) signal over the Indian Ocean (Phase 3) appeared incoherent for most of September 2021 due to interference with other tropical waves. In the last week of September, an MJO signal emerged over the Maritime Continent (Phase 4). Phase 3 tends to bring wetter conditions to western Maritime Continent while Phase 4 tends to bring wetter conditions to much of the region at this time of the year.

mjo_phase_diagram


Figure 3: The MJO phase diagram. The diagram illustrates the movement of the MJO through different phases, which correspond to different locations along the equator (denoted in the text with the first day of the month in blue and the last day of the month in red). The distance of the index from the centre of the diagram is related to the strength of the MJO. Values within the grey circle are considered weak or indiscernible (data from the Bureau of Meteorology, Australia).


2.2 In September, there have been some signs of La Niña-like conditions developing in the tropical Pacific. However, atmospheric indicators (OLR and wind anomalies) have not shown consistent La Niña-like conditions yet. A weak negative Indian Ocean Dipole (IOD) was present and at the seasonal timescale, negative IOD events tend to bring wetter conditions to the southern Maritime Continent.

September 14, 2021

Review of Regional Weather for August 2021

Review of Regional Weather for August 2021

1. Overview

1.1 During August 2021, there was above-average rainfall recorded over much of the ASEAN region, while below-average rainfall was recorded over the northeastern ASEAN region (Figure 1). The largest positive anomalies (wetter conditions) were found across the equatorial region for both satellite-derived rainfall estimates datasets (GSMaP-NRT and CMORPH-Blended). The two datasets were also in agreement that the largest negative anomalies over land (drier conditions) were observed over parts of northern Viet Nam. However, there were some discrepancies over the southern Myanmar, where CMORPH-Blended recorded wetter conditions while GSMaP-NRT recorded drier conditions.

1.2 The observed rainfall anomaly pattern of above-average rainfall for much of the ASEAN region is broadly consistent with the predictions from the subseasonal weather outlooks for August 2021 (26 July – 8 August, 9 – 22 August and 23 August – 5 September).

era5_rainfall_anomalies
cmorph_bld_rainfall_anomalies
Figure 1: Rainfall anomalies for the month of August 2021 based on GSMaP-NRT data (left) and CMORPH-Blended data (right). The climatological reference period is 2001-2020. Green colour denotes above-average rainfall (wetter), while orange denotes below-average rainfall (drier).


1.3 Most of the northern ASEAN region and southern Maritime Continent experienced above-average temperatures during August 2021 (Figure 2). The warmest anomalies (above-average temperature) were recorded over northern Viet Nam, where the drier conditions were observed. For the equatorial region and central and northern Myanmar, near- to below-average temperature was recorded.

era5_temperature_anomalies


Figure 2: Temperature anomalies for the month of August 2021 based on ERA-5 reanalysis. The climatological reference period is 2001-2020. Red colour denotes above-average temperature (warmer), while blue denotes below-average temperature (colder).


2. Climate Drivers

2.1 At the start of August 2021, a Madden-Julian Oscillation (MJO) signal was present in the Western Hemisphere (Phase 8, Figure 3), which weakened by the middle of the first week based on the RMM plot. The signal emerged over the Indian Ocean (Phase 2) in the second week of August, with a rapid strengthening of the signal in the RMM plot and slow eastward propagation. This MJO signal weakened in the second half of August while it was still over the Indian Ocean. The mix of below- to above-average rainfall for the ASEAN region is indicative of the MJO signal: Phase 2 tends to bring drier conditions over the northeastern ASEAN region and wetter conditions for the western Maritime Continent at this time of the year.

mjo_phase_diagram


Figure 3: The MJO phase diagram. The diagram illustrates the movement of the MJO through different phases, which correspond to different locations along the equator (denoted in the text with the first day of the month in blue and the last day of the month in red). The distance of the index from the centre of the diagram is related to the strength of the MJO. Values within the grey circle are considered weak or indiscernible (data from the Bureau of Meteorology, Australia).


2.2 The equatorial Pacific Ocean was in the ‘ENSO-neutral’ state while a negative Indian Ocean Dipole (IOD) was present in August. At the seasonal timescale, negative IOD events tend to bring wetter conditions to the southern Maritime Continent.

August 13, 2021

Review of Regional Weather for July 2021

Review of Regional Weather for July 2021

1. Overview

1.1 During July 2021, there was a mix of below- to above-average rainfall over the ASEAN region (Figure 1). The largest positive anomalies (wetter conditions) were over the coastal parts of southern Myanmar, southern Cambodia, northwestern Philippines, as well as the Maluku Islands for both satellite-derived rainfall estimates datasets (GSMaP-NRT and CMORPH-Blended). The two datasets were also in agreement that the largest negative anomalies (drier conditions) were over the central Philippines. However, there were some discrepancies over the western and central Maritime Continent, where CMORPH-Blended recorded drier conditions than GSMaP-NRT.

1.2 The observed rainfall anomaly pattern (i.e. mix of below- to above-average rainfall) is broadly consistent with the predictions from the subseasonal weather outlooks for July 2021 (28 June – 11 July and 12 – 25 July). The only portion of the ASEAN region with a consistent outlook for July were the wetter conditions in the southeastern Maritime Continent, which agrees with the observed anomaly pattern.

era5_rainfall_anomalies
cmorph_bld_rainfall_anomalies
Figure 1: Rainfall anomalies for the month of July 2021 based on GSMaP-NRT data (left) and CMORPH-Blended data (right). The climatological reference period is 2001-2020. Green colour denotes above-average rainfall (wetter), while orange denotes below-average rainfall (drier).


1.3 Most of the ASEAN region experienced above-average temperatures during July 2021 (Figure 2). The warmest anomalies (above-average temperature) were recorded over Lao PDR and the southern Maritime Continent, followed by central and northern Myanmar, Viet Nam, and central and southern parts of the Philippines. Elsewhere, near- to above-average temperature were recorded.

era5_temperature_anomalies


Figure 2: Temperature anomalies for the month of July 2021 based on ERA-5 reanalysis. The climatological reference period is 2001-2020. Red colour denotes above-average temperature (warmer), while blue denotes below-average temperature (colder).


2. Climate Drivers

2.1 At the start of July 2021, a Madden-Julian Oscillation (MJO) signal was present in the Indian Ocean (Phases 2 and 3, Figure 3). In the second week of July the signal propagated eastwards over the Maritime Continent (Phases 4 and 5). The signal then weakened slightly as it moved over the Western Pacific (Phases 6 and 7), although it strengthened again entering the Western Hemisphere (Phase 8) at the end of July. The mix of below- to above-average rainfall for the ASEAN region is indicative of the near complete circumnavigation of the MJO signal: Phases 3 to 4 tend to bring wetter conditions to much of the region, while Phases 7 to 8 tend to bring drier conditions, and Phase 2 and Phase 5 bring a mix of drier and wetter conditions at this time of the year.

mjo_phase_diagram


Figure 3: The MJO phase diagram. The diagram illustrates the movement of the MJO through different phases, which correspond to different locations along the equator (denoted in the text with the first day of the month in blue and the last day of the month in red). The distance of the index from the centre of the diagram is related to the strength of the MJO. Values within the grey circle are considered weak or indiscernible (data from the Bureau of Meteorology, Australia).


2.2 The equatorial Pacific Ocean is currently in an ‘ENSO-neutral’ state. A negative Indian Ocean Dipole (IOD) has developed in the Indian Ocean, with warmer sea surface temperatures southwest of Java during July. At the seasonal timescale, negative IOD events tend to bring wetter conditions to the southern Maritime Continent.

July 14, 2021

Review of Regional Weather for June 2021

Review of Regional Weather for June 2021

1. Overview

1.1 During June 2021, there was a mix of below- to above-average rainfall over the ASEAN region (Figure 1). Much of the western and central Maritime Continent (except for parts of eastern Borneo), and the north-eastern parts of Mainland Southeast Asia experienced above-average rainfall. The largest positive anomalies (wetter conditions) were recorded over central Java regions and northern Viet Nam (due to Tropical Storm Koguma made landfall in mid-June) for both satellite-derived rainfall estimates datasets (GSMaP-NRT and CMORPH-Blended). A band of below-average rainfall between 8°N and 14°N was recorded, in particular parts of southern Mainland Southeast Asia. Elsewhere, the land masses of the eastern Maritime Continent predominately experienced below-average rainfall, except for central parts of the Philippines which experienced above-average rainfall due to Tropical Storm Choi-Wan in early June.

1.2 The observed rainfall anomaly pattern (i.e. below-average rainfall over southern and northern parts of the Philippines , above-normal rainfall in the Java region) is broadly consistent with the predictions from the subseasonal weather outlooks for June 2021 (31 May – 13 June, 14 – 27 June, 28 June – 11 July), apart from the positive anomalies (wetter conditions) for central Sumatra and the north-eastern parts of Mainland Southeast Asia not highlighted in the outlooks.

era5_rainfall_anomalies
cmorph_bld_rainfall_anomalies
Figure 1: Rainfall anomalies for the month of June 2021 based on GSMaP-NRT data (left) and CMORPH-Blended data (right). The climatological reference period is 2001-2020. Green colour denotes above-average rainfall (wetter), while orange denotes below-average rainfall (drier).


1.3 Most of the Mainland Southeast Asia experienced near- to above-average temperatures during June 2021, in particular warmer temperature for northern Myanmar, central Thailand, northern Cambodia and northern Viet Nam (Figure 2). Above-average temperatures were also experienced over northern Philippines and southern Maritime Continent. Elsewhere in the Maritime Continent, near-average temperatures were experienced in most of the region, with below-average temperatures for northern Sumatra and parts of Peninsular Malaysia.

era5_temperature_anomalies


Figure 2: Temperature anomalies for the month of June 2021 based on ERA-5 reanalysis. The climatological reference period is 2001-2020. Red colour denotes above-average temperature (warmer), while blue denotes below-average temperature (colder).


2. Climate Drivers

2.1 The Madden-Julian Oscillation (MJO, Figure 3) signal was incoherent for most of the first three weeks of June 2021 due to interference with other tropical waves. In the last week of June, an MJO signal emerged over the Western Hemisphere and Africa (Phase 1) and propagated eastwards to over the Indian Ocean (Phase 2). Phase 2 tends to bring wetter conditions to western Maritime Continent.

mjo_phase_diagram


Figure 3: The MJO phase diagram. The diagram illustrates the movement of the MJO through different phases, which correspond to different locations along the equator (denoted in the text with the first day of the month in blue and the last day of the month in red). The distance of the index from the centre of the diagram is related to the strength of the MJO. Values within the grey circle are considered weak or indiscernible (data from the Bureau of Meteorology, Australia).


2.2 The equatorial Pacific Ocean is currently in an ‘ENSO neutral’ state. There are some signs of a negative Indian Ocean Dipole (IOD) developing in the Indian Ocean, with warmer sea surface temperatures south-west of Java. At the seasonal timescale, negative IOD events tend to bring wetter conditions to the southern Maritime Continent.

June 14, 2021

Review of Regional Weather for May 2021

Review of Regional Weather for May 2021

1. Overview

1.1 During May 2021, there was a mix of below- to above-average rainfall over the ASEAN region. For the equatorial region, the GSMaP-NRT dataset (Figure 1a) shows near- to above-average rainfall (except for parts of central Borneo), while the CMORPH-Blended dataset (Figure 1b) shows a mixture of below- and above-average rainfall. The largest positive anomalies (wetter conditions) were recorded over southern Philippines for both satellite-derived rainfall estimates datasets, due to Tropical Depression 03W. Elsewhere in the Maritime Continent, the southern Maritime Continent and northern Philippines experienced below-average rainfall, with the largest negative anomalies (drier conditions) recorded over northern Philippines. For Mainland Southeast Asia, parts of central Mainland Southeast Asia experienced below-average rainfall, with CMORPH-Blended showing a larger proportion of Thailand receiving below-average rainfall, while GSMaP-NRT extended the below-average rainfall over coastal Myanmar. Near- to above-average rainfall was experienced elsewhere in Mainland Southeast Asia.
 

1.2 The observed rainfall anomaly pattern (i.e. below-average rainfall over southern Maritime Continent, above-normal rainfall in the equatorial region) is broadly consistent with the predictions from the subseasonal weather outlooks for May 2021 (3 – 16 May, 17 – 30 May).

era5_rainfall_anomalies
cmorph_bld_rainfall_anomalies
Figure 1: Rainfall anomalies for the month of May 2021 based on GSMaP-NRT data (left) and CMORPH-Blended data (right). The climatological reference period is 2001-2020. Green colour denotes above-average rainfall (wetter), while orange denotes below-average rainfall (drier).


1.3 Most of Mainland Southeast Asia experienced above-average temperatures during May 2021, except for parts of Myanmar, Cambodia, and southern Viet Nam (Figure 2). Above-average temperatures were also experienced in northern Philippines and the southern Maritime Continent. Elsewhere, near-average temperatures were experienced, apart from below-average temperature for southern Philippines associated with the heavy rainfall.

era5_temperature_anomalies


Figure 2: Temperature anomalies for the month of May 2021 based on ERA-5 reanalysis. The climatological reference period is 2001-2020. Red colour denotes above-average temperature (warmer), while blue denotes below-average temperature (colder).


2. Climate Drivers

2.1 At the start of May 2021, a strong Madden-Julian Oscillation (MJO, Figure 3) signal was present in Phase 1 (Western Hemisphere). The signal then propagated eastward into the Indian Ocean (Phases 2 and 3), where it became less coherent for some time before strengthening again and propagating eastwards to the Maritime Continent (Phases 4 and 5). It subsequently weakened upon approaching Phase 6 with no coherent MJO signal for the rest of the month based on the RMM index. Phases 3 and 4 tend to bring wetter conditions to much of the Maritime Content, Phase 5 tends to bring wetter conditions to the eastern half of the Maritime Content, while Phase 6 tends to bring drier conditions to the western half of the Maritime Continent.

mjo_phase_diagram


Figure 3: The MJO phase diagram. The diagram illustrates the movement of the MJO through different phases, which correspond to different locations along the equator (denoted in the text with the first day of the month in blue and the last day of the month in red). The distance of the index from the centre of the diagram is related to the strength of the MJO. Values within the grey circle are considered weak or indiscernible (data from the Bureau of Meteorology, Australia).


2.2 Over the tropical Pacific Ocean, La Niña conditions decayed and returned to ENSO-neutral conditions by the beginning of June. The sea surface temperatures in the central and eastern Pacific Ocean continued to warm, with atmospheric indicators (cloudiness and wind anomalies) remaining consistent with the ENSO-neutral conditions.

May 14, 2021

Review of Regional Weather for April 2021

Review of Regional Weather for April 2021

1. Overview

1.1 During April 2021, much of the Mainland Southeast Asia and the Malay Peninsula experienced above-average rainfall (Figure 1). The largest positive anomalies (wetter conditions) were recorded over northern parts of Thailand and Lao DPR for both satellite-derived rainfall estimates datasets (GSMaP-NRT and CMORPH-Blended), with GSMaP-NRT also recording larger anomalies over Peninsular Malaysia and eastern side of northern Sumatra. Large positive anomalies were also recorded over the eastern part of central Philippines and the region around Nusa Tenggara due to Typhoon Surigae and Tropical Cyclone Seroja, respectively. Much of the rest of the Maritime Continent experienced below-average rainfall.

1.2 The observed large-scale rainfall anomaly pattern (i.e. above-average rainfall over the northern ASEAN region and drier conditions in the southern ASEAN region) is broadly consistent with the predictions from the subseasonal weather outlooks for April 2021 (5 – 18 Apr, 19 Apr – 2 May).

era5_rainfall_anomalies
cmorph_bld_rainfall_anomalies
Figure 1: Rainfall anomalies for the month of April 2021 based on GSMaP-NRT data (left) and CMORPH-Blended data (right). The climatological reference period is 2001-2020. Green colour denotes above-average rainfall (wetter), while orange denotes below-average rainfall (drier).


1.3 Most parts of the northern ASEAN region experienced below-average temperatures during April 2021, apart from northern parts of Myanmar and Viet Nam where above-average temperatures were recorded (Figure 2). In contrast, most parts of the southern ASEAN region experienced near- to above-average temperatures.

era5_temperature_anomalies


Figure 2: Temperature anomalies for the month of April 2021 based on ERA-5 reanalysis. The climatological reference period is 2001-2020. Red colour denotes above-average temperature (warmer), while blue denotes below-average temperature (colder).


2. Climate Drivers

2.1 At the start of April 2021, a Madden-Julian Oscillation (MJO, Figure 3) signal was present in Phase 5 (Maritime Continent). The signal then propagated eastward into the Western Pacific (Phases 6 and 7). The signal became less coherent for a time in Phase 7, before strengthening again and propagating eastwards into the Western Hemisphere (Phase 8) at the end of the month. Phase 5 tends to bring wetter conditions to the eastern half of the Maritime Content, while Phase 6 tends to bring drier conditions to the western half. Phases 7 and 8 tend to bring drier conditions to much of the Maritime Continent, similar to what is observed from the rainfall anomalies in Figure 1.

mjo_phase_diagram


Figure 3: The MJO phase diagram. The diagram illustrates the movement of the MJO through different phases, which correspond to different locations along the equator (denoted in the text with the first day of the month in blue and the last day of the month in red). The distance of the index from the centre of the diagram is related to the strength of the MJO. Values within the grey circle are considered weak or indiscernible (data from the Bureau of Meteorology, Australia).


2.2 Over the tropical Pacific Ocean, La Niña conditions were present but weakening. Overall, the sea surface temperatures in the central and eastern Pacific Ocean remained cool, with atmospheric indicators (cloudiness and wind anomalies) remaining consistent with the weakening La Niña conditions. La Niña events tend to bring wetter-than-average conditions to parts of Southeast Asia during the March to May period.

April 12, 2021

Review of Regional Weather for March 2021

Review of Regional Weather for March 2021

1. Overview

1.1 During March 2021, much of the land masses of the Maritime Continent experienced above-average rainfall (Figure 1). The largest positive anomalies (wetter conditions) were recorded over western coastal parts of Sumatra, eastern coastal parts of Peninsular Malaysia and western Borneo based on both satellite-derived rainfall estimates datasets (GSMaP-NRT and CMORPH-Blended). For Mainland Southeast Asia, rainfall anomalies were largely negligible for most of the region, as expected during the dry season for the northern ASEAN region, except for the southern tips of Thailand and Myanmar where the dry conditions are more pronounced.
 

1.2 The observed large-scale rainfall anomaly pattern (i.e. above-average rainfall over land masses of the Maritime Continent is broadly consistent with the predictions from the subseasonal weather outlooks for March 2021 (22 Feb – 7 Mar, 8 – 21 Mar, 22 Mar – 4 Apr), apart from the anomalies for some parts of southern Sumatra and central Java not highlighted in the outlooks.

era5_rainfall_anomalies
cmorph_bld_rainfall_anomalies
Figure 1: Rainfall anomalies for the month of March 2021 based on GSMaP-NRT data (left) and CMORPH-Blended data (right). The climatological reference period is 2001-2020. Green colour denotes above-average rainfall (wetter), while orange denotes below-average rainfall (drier).


1.3 Most parts of Southeast Asia south of 10°N experienced near-average temperatures during March 2021 (Figure 2). In contrast, warmer-than-average temperatures were recorded over most of Southeast Asia north of 10°N, except for some south-eastern parts of Mainland Southeast Asia where below- to near-average temperatures are observed.

era5_temperature_anomalies


Figure 2: Temperature anomalies for the month of March 2021 based on ERA-5 reanalysis. The climatological reference period is 2001-2020. Red colour denotes above-average temperature (warmer), while blue denotes below-average temperature (colder).


2. Climate Drivers

2.1 During the first half of March 2021, the Madden-Julian Oscillation (MJO) signal was weak (Figure 3). In the second half of March, it strengthened in the Western Hemisphere (Phases 8 and 1) and propagated eastward through the Indian Ocean (Phases 2 and 3) and western Maritime Continent (Phase 4). Phase 2 and Phase 3 tend to bring wetter conditions to western Maritime Continent and whole of Maritime Continent respectively.

mjo_phase_diagram


Figure 3: The MJO phase diagram. The diagram illustrates the movement of the MJO through different phases, which correspond to different locations along the equator (denoted in the text with the first day of the month in blue and the last day of the month in red). The distance of the index from the centre of the diagram is related to the strength of the MJO. Values within the grey circle are considered weak or indiscernible (data from the Bureau of Meteorology, Australia).


2.2 Over the tropical Pacific Ocean, La Niña conditions were present but weakening. Overall, the sea surface temperatures in the central and eastern Pacific Ocean remained cool, with atmospheric indicators (cloudiness and wind anomalies) remaining consistent with the weakening La Niña conditions. La Niña events tend to bring wetter-than-average conditions to much of Southeast Asia during the September to March period.