Review of Regional Weather for September 2025
1. Overview
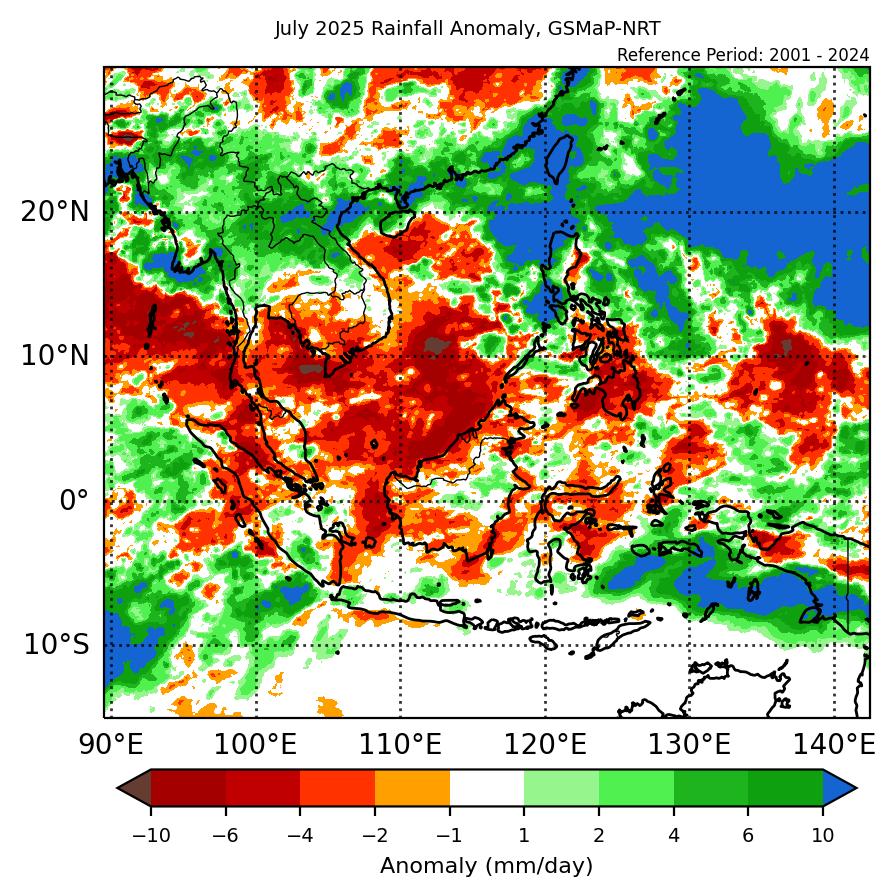
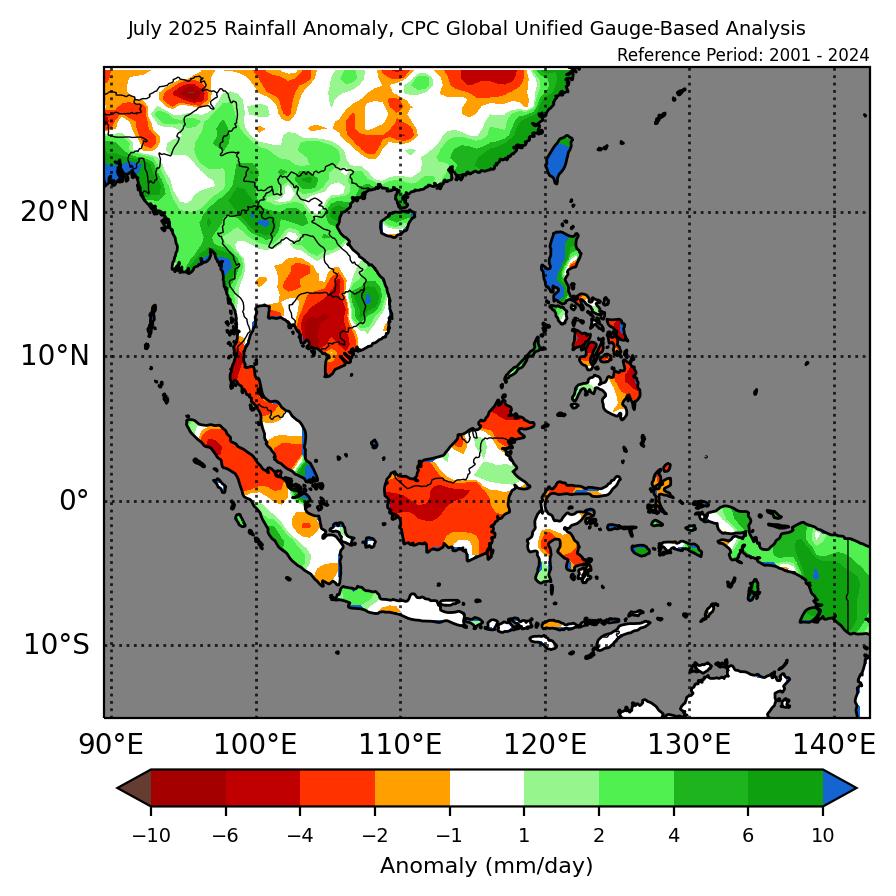
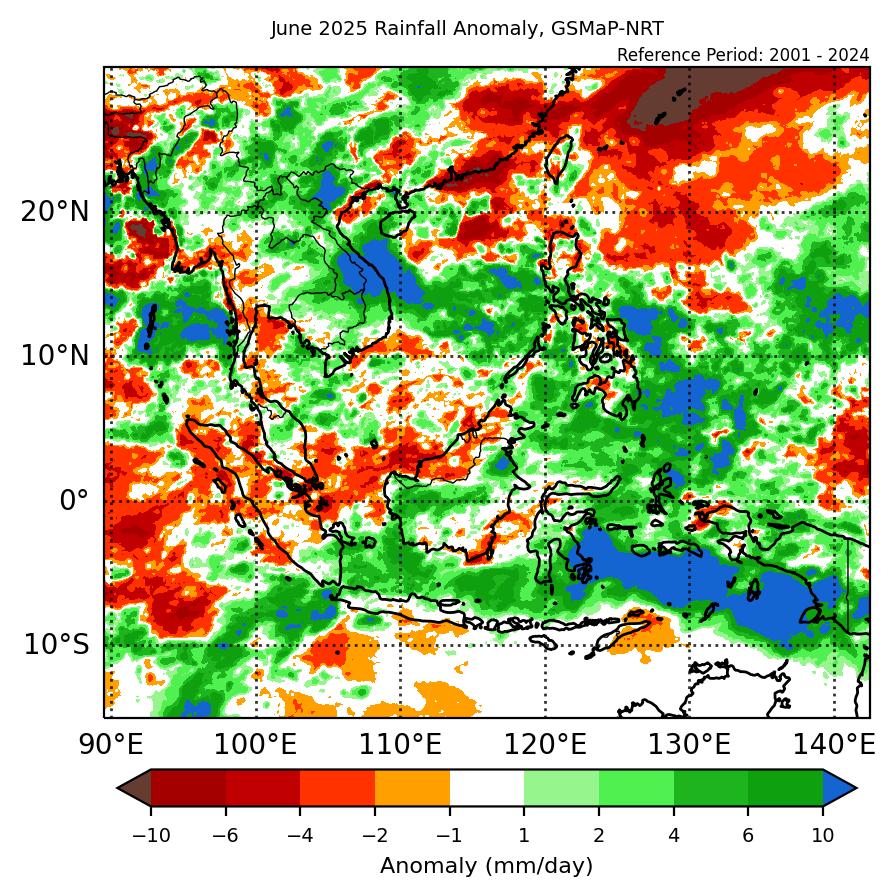
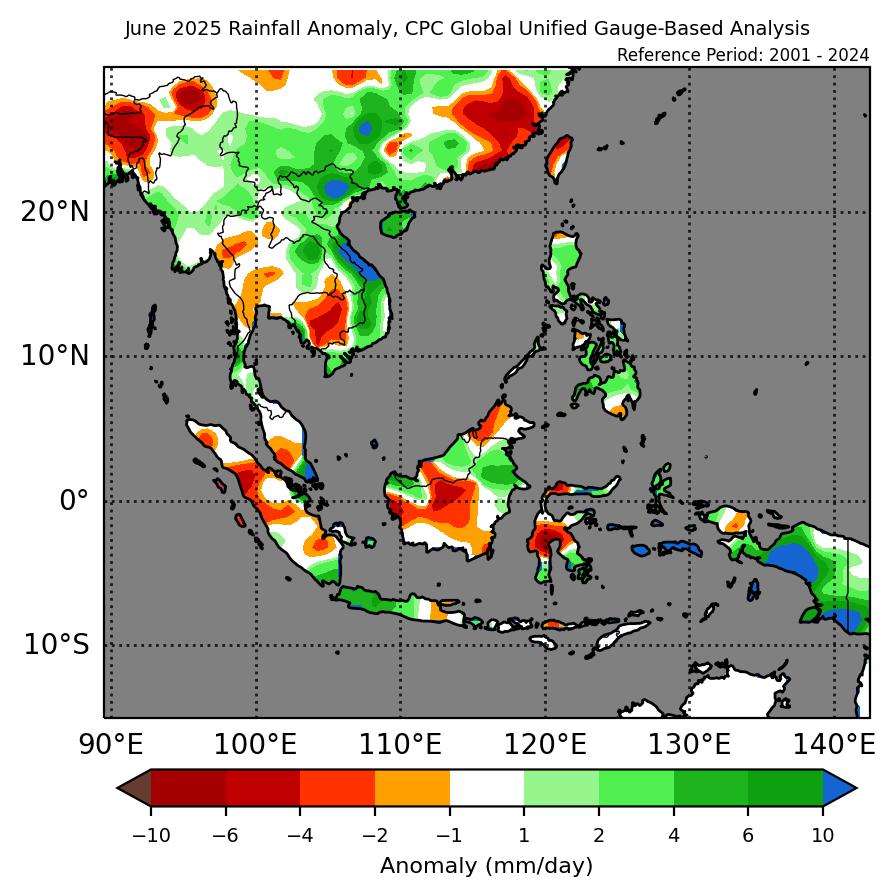
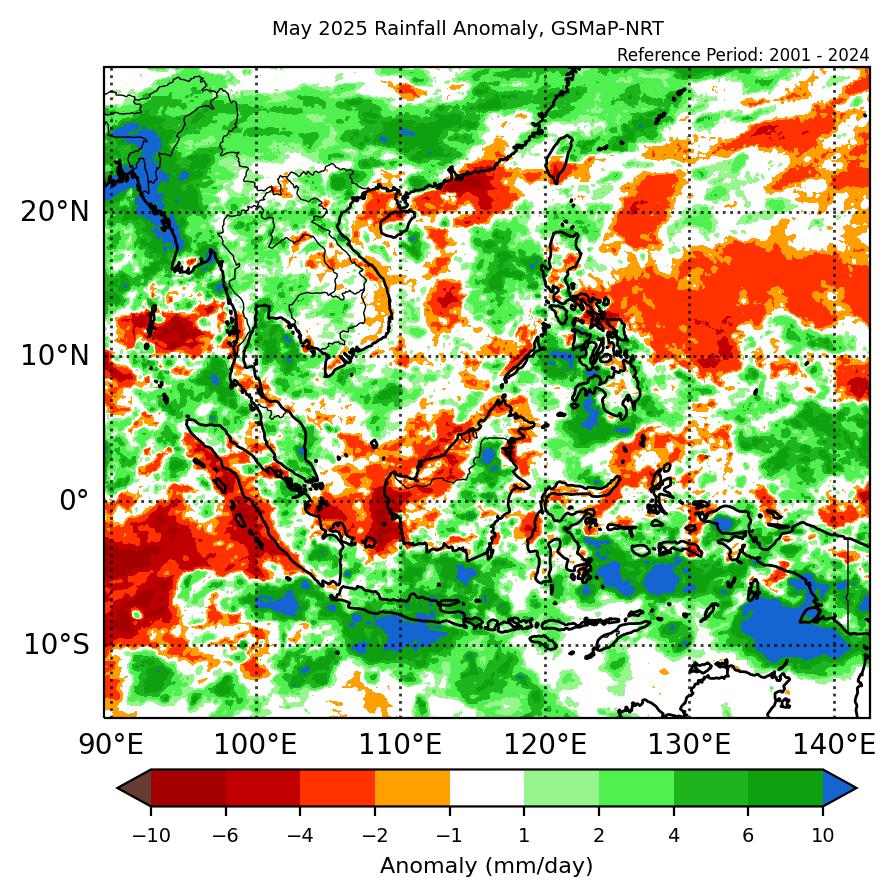
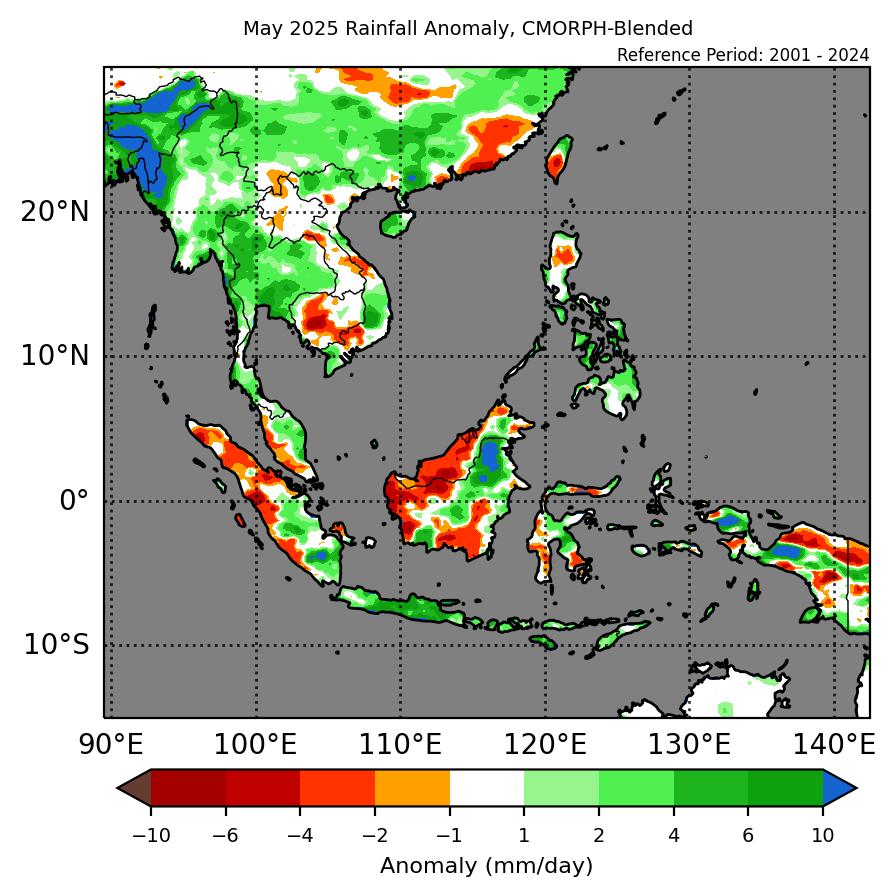
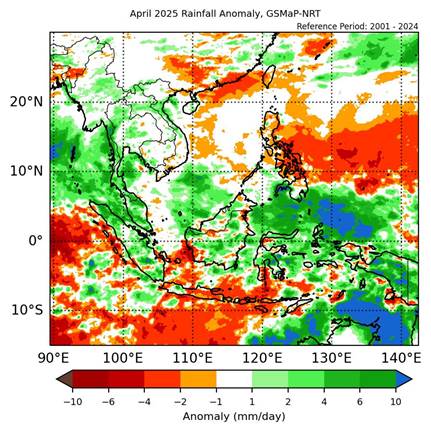
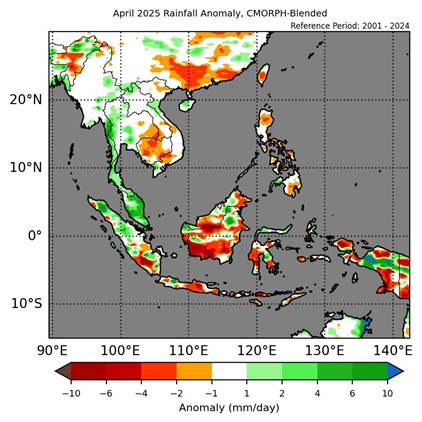
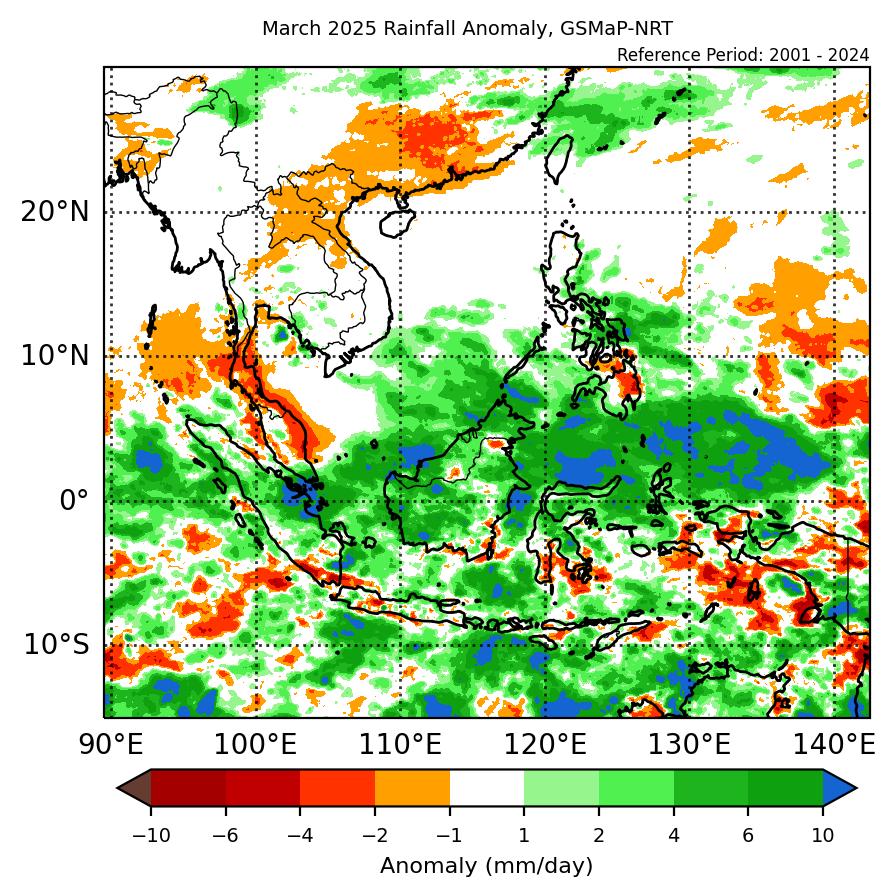
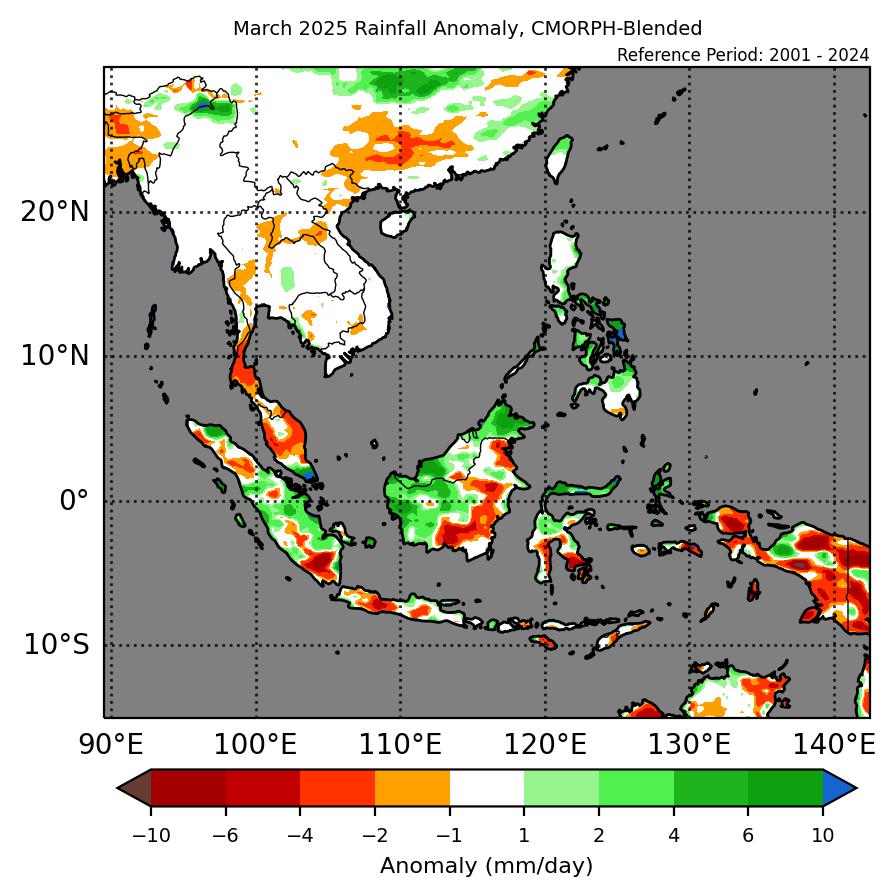
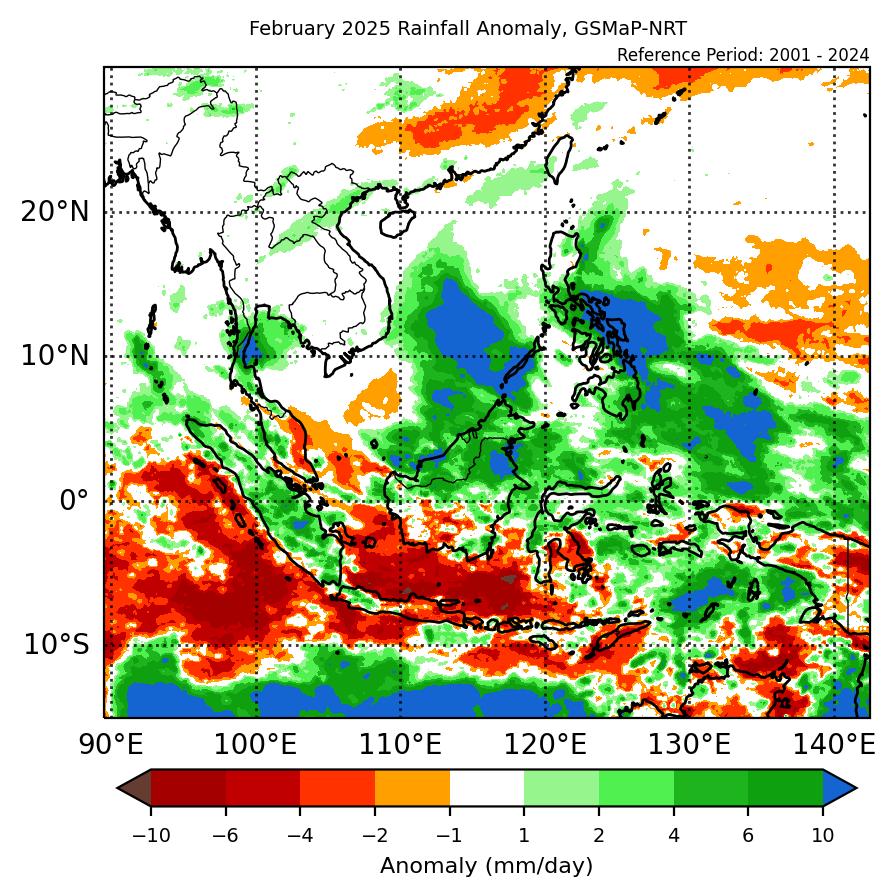
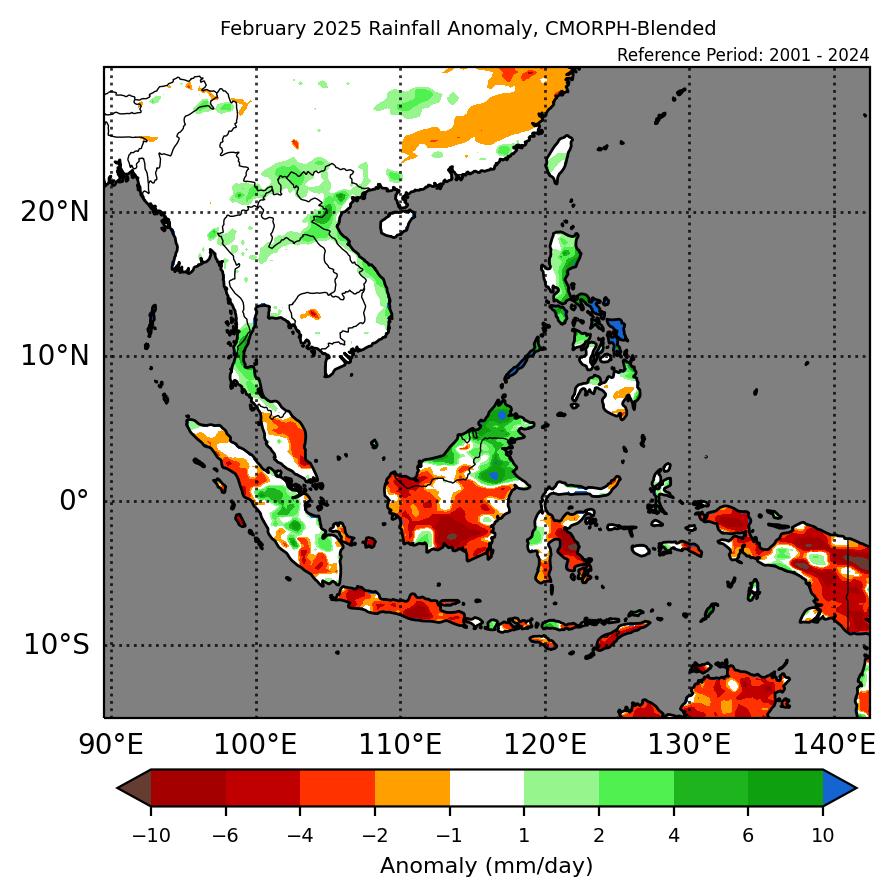
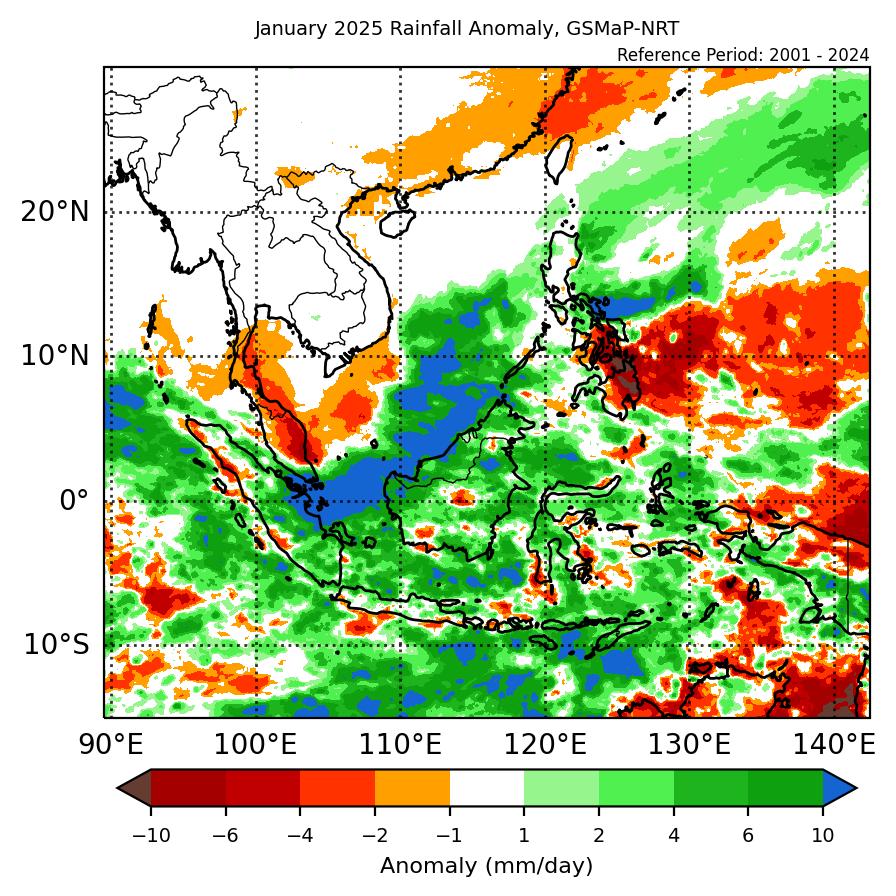
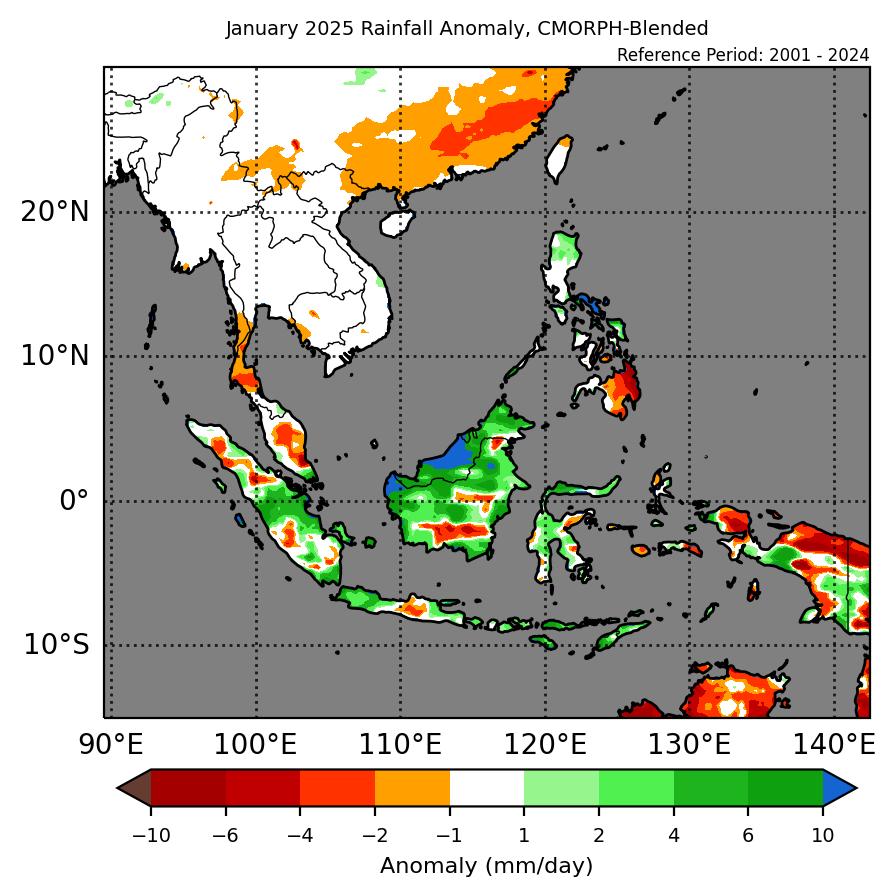
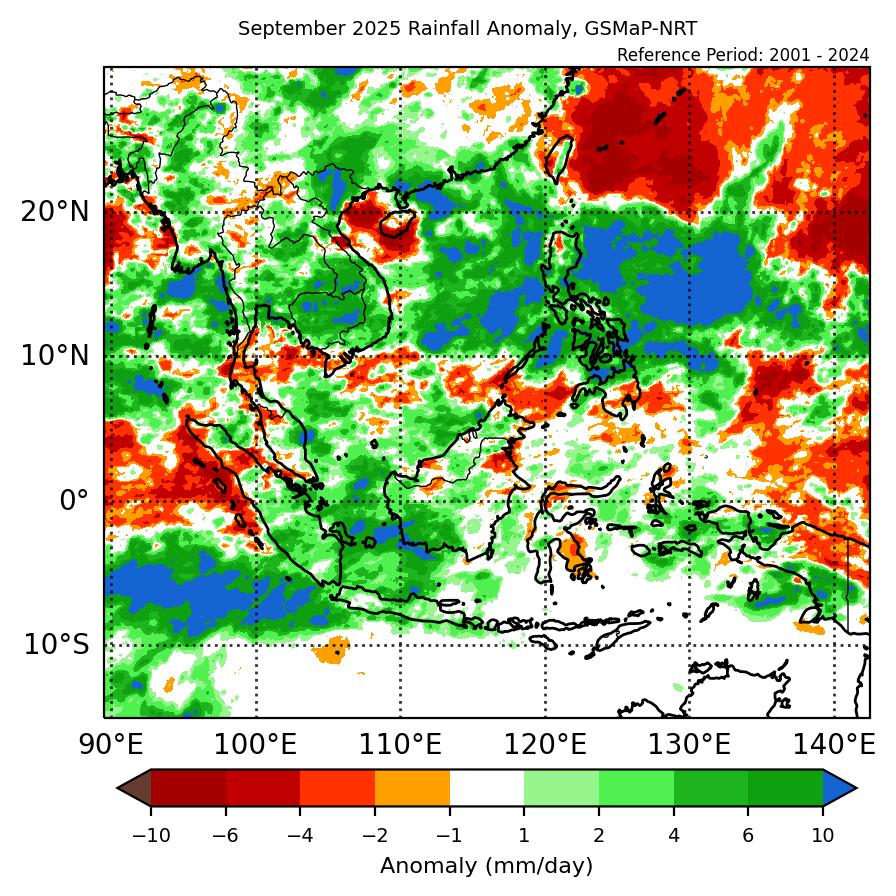
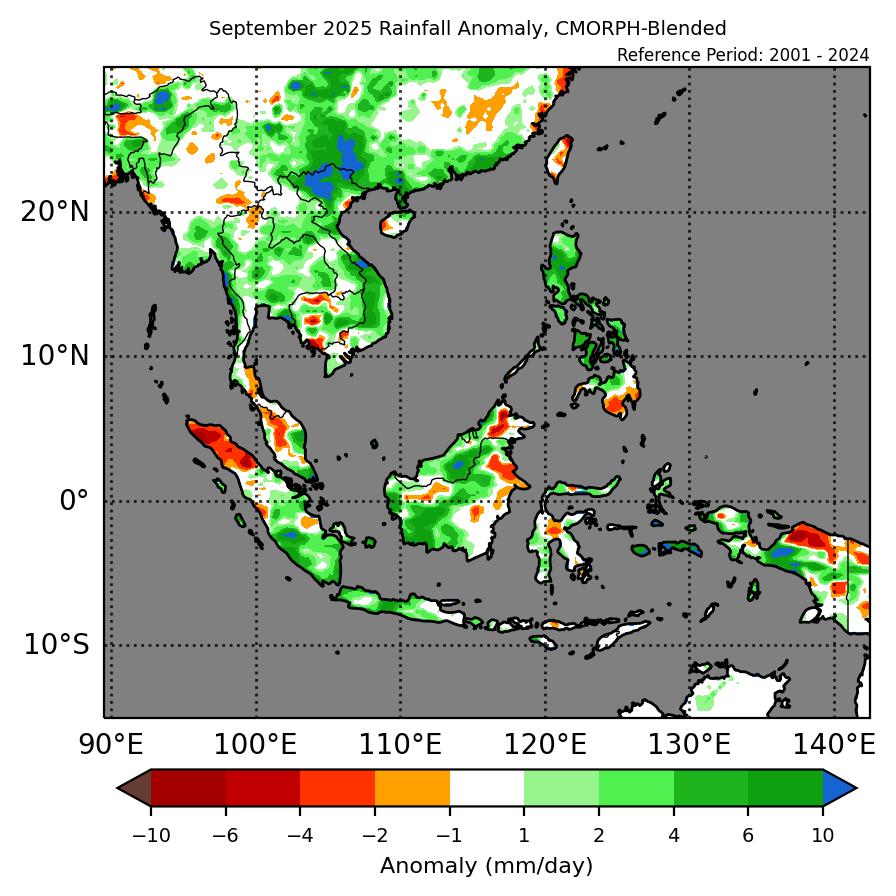
1.1 During September 2025, many parts of Southeast Asia experienced above-average rainfall (Figure 1). Most of the Maritime Continent recorded positive (wetter) anomalies in both datasets (GSMaP-NRT and CMORPH-Blended), although CMORH-Blended (Figure 1, right) recorded more extensive negative (drier) anomalies over the northwestern part of the region . Over Mainland Southeast Asia, positive anomalies were recorded over the eastern and central parts of the region. Over the western parts, the two datasets disagree, with GSMaP-NRT recorded mostly above-average rainfall while CMORPH-Blended recorded near-average rainfall over this region. The largest positive (wetter) anomalies over Southeast Asia were recorded over northeastern Mainland Southeast Asia and much of the Philippines.
1.2 The observed rainfall anomaly pattern of above-average rainfall over much of the Maritime Continent is consistent with the predictions from the subseasonal weather outlooks for September 2025 (1 – 14 Sep 2025 and 15 – 28 Aug 2025). The subseasonal weather outlooks also predicted a mix of below-and above-average rainfall over parts of Mainland Southeast Asia, in line with the observations. The observations are also somewhat consistent with the seasonal outlook for September 2025, which predicted an increase in chance of above-normal rainfall in the southern and eastern Maritime Continent.
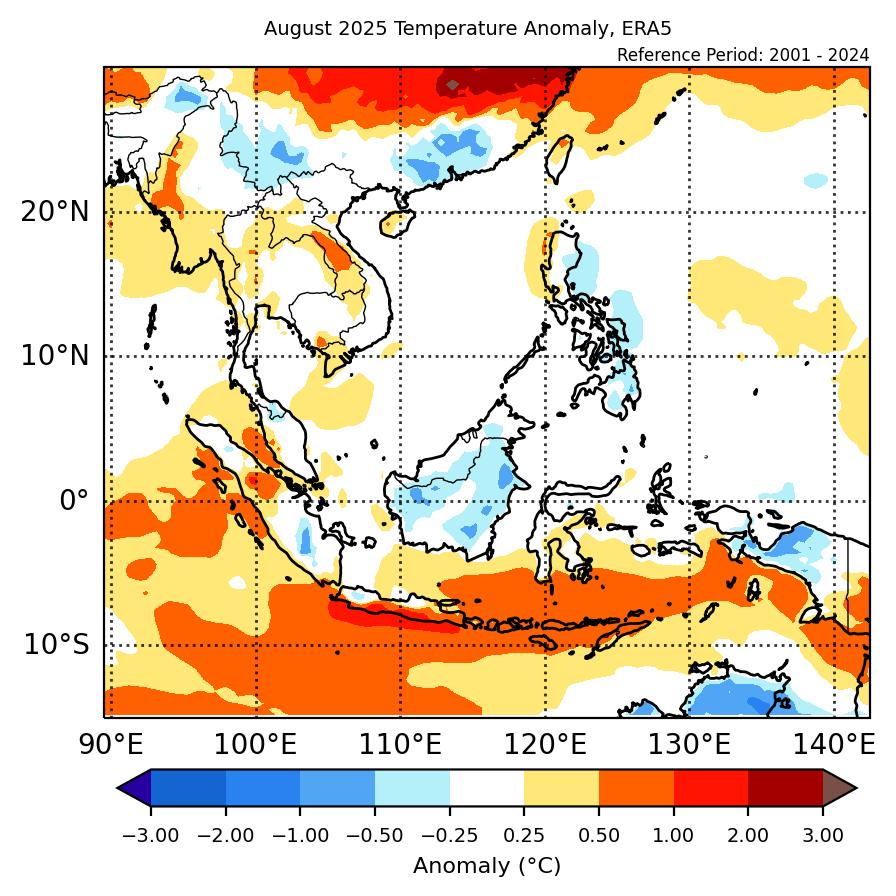
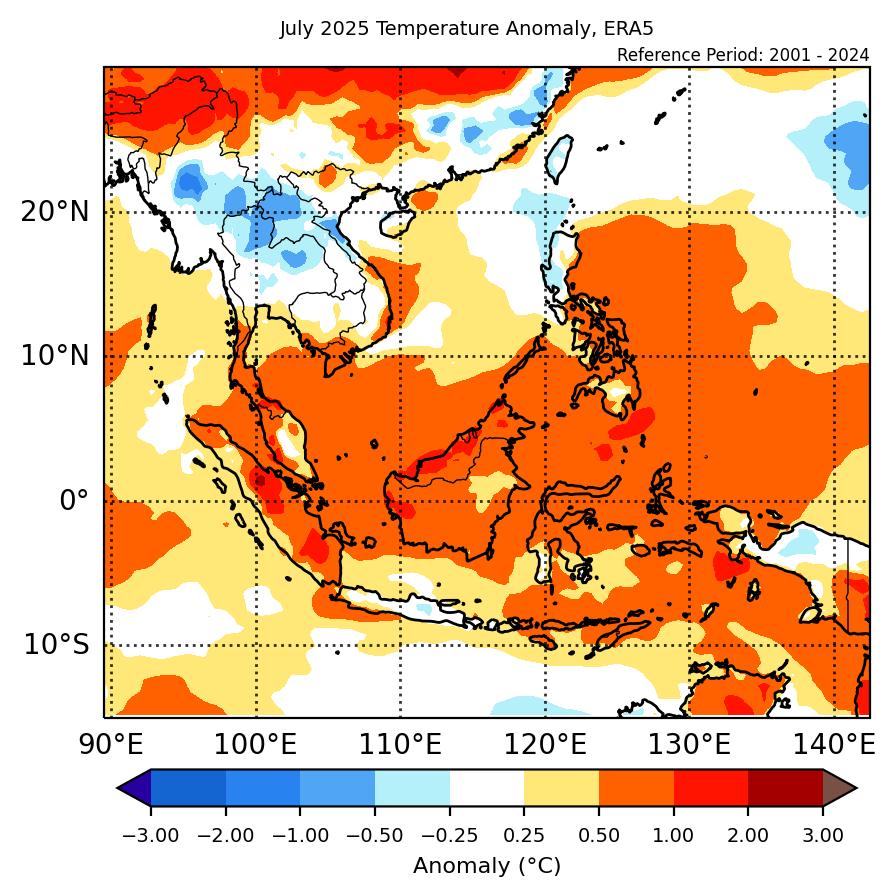
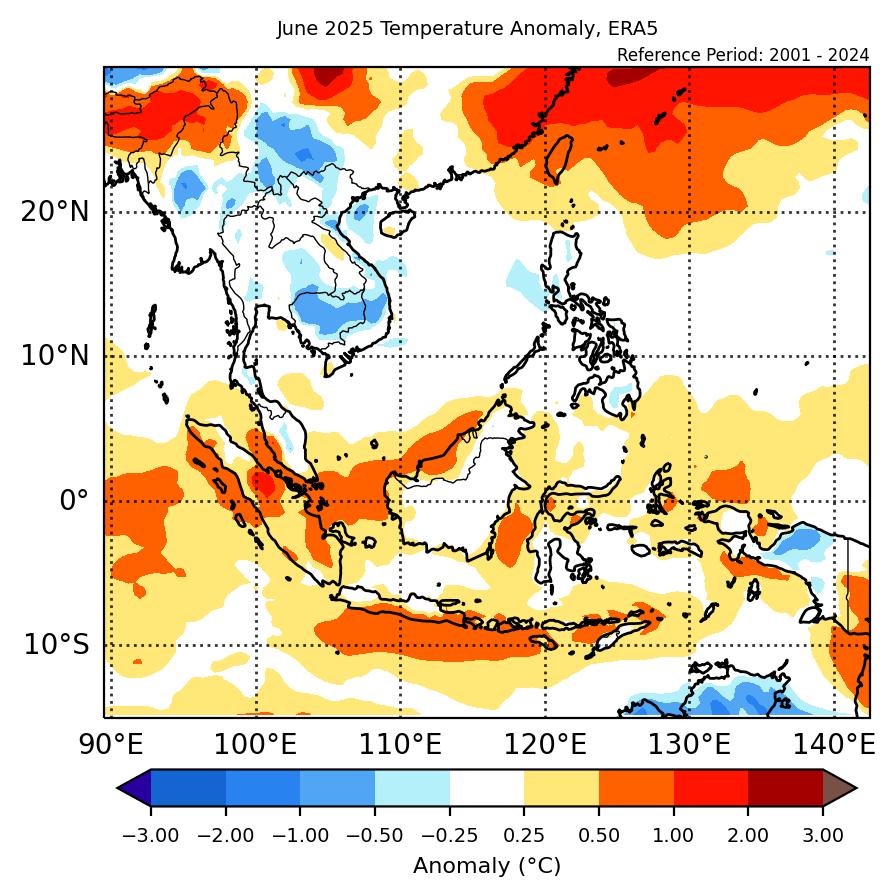
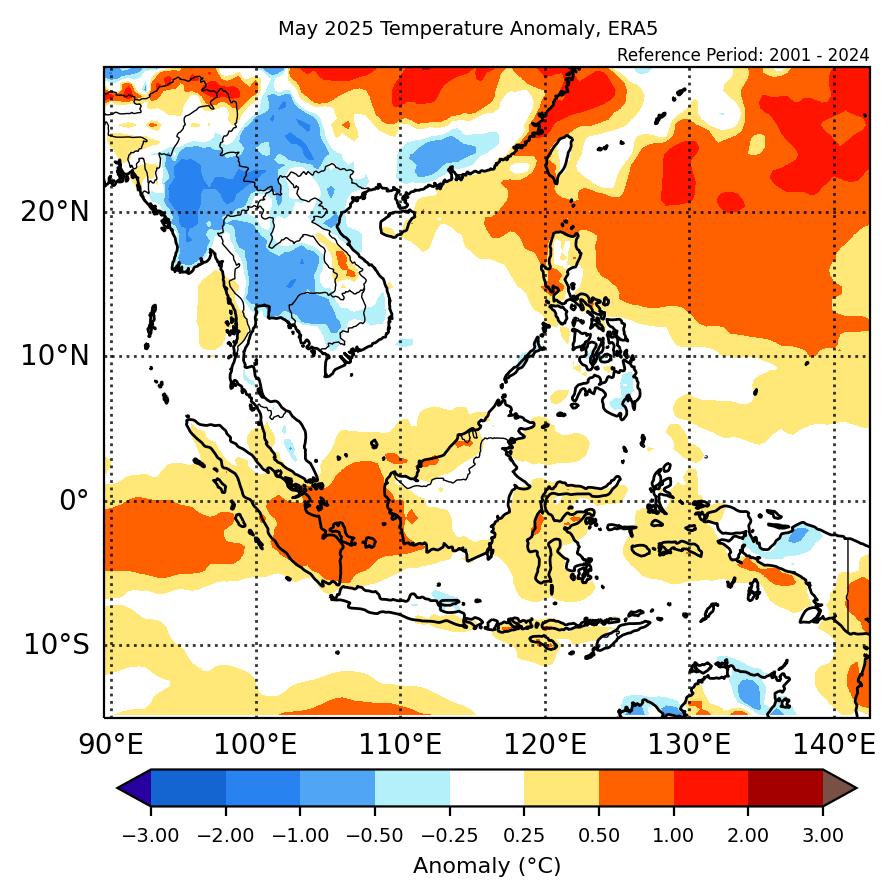
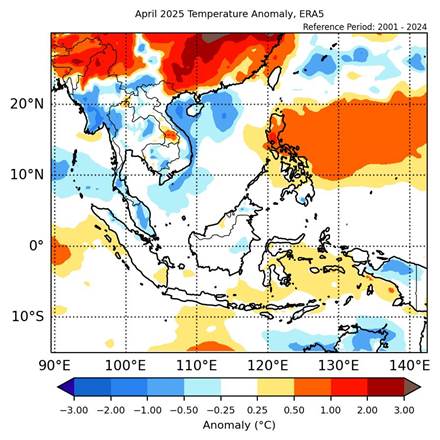
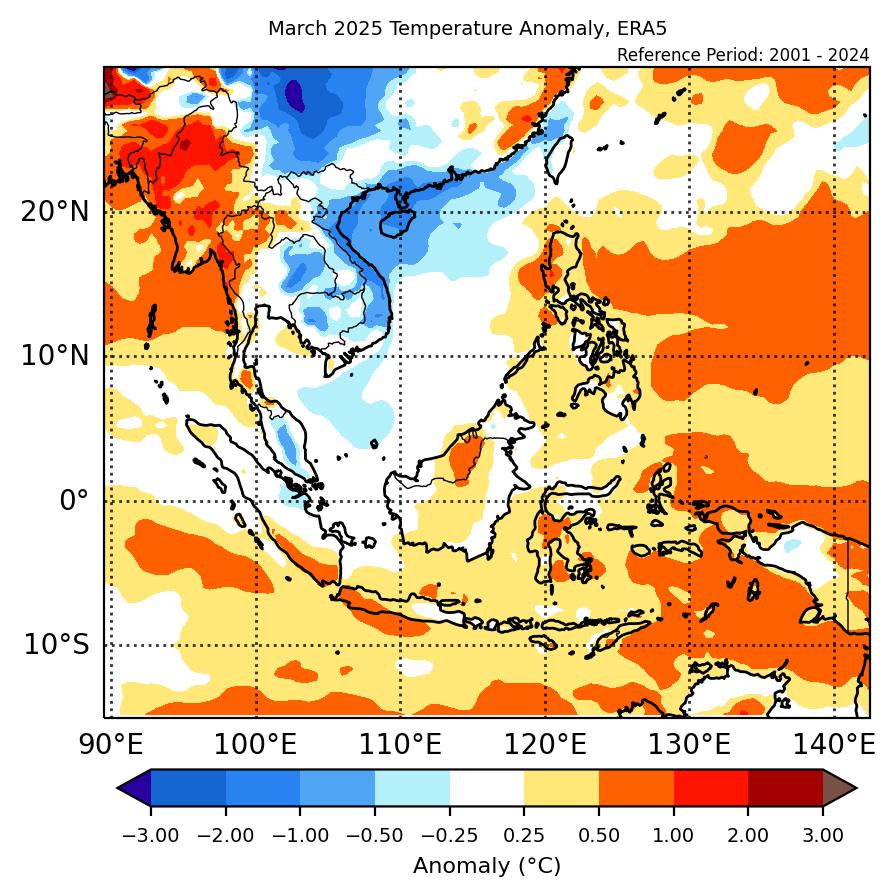
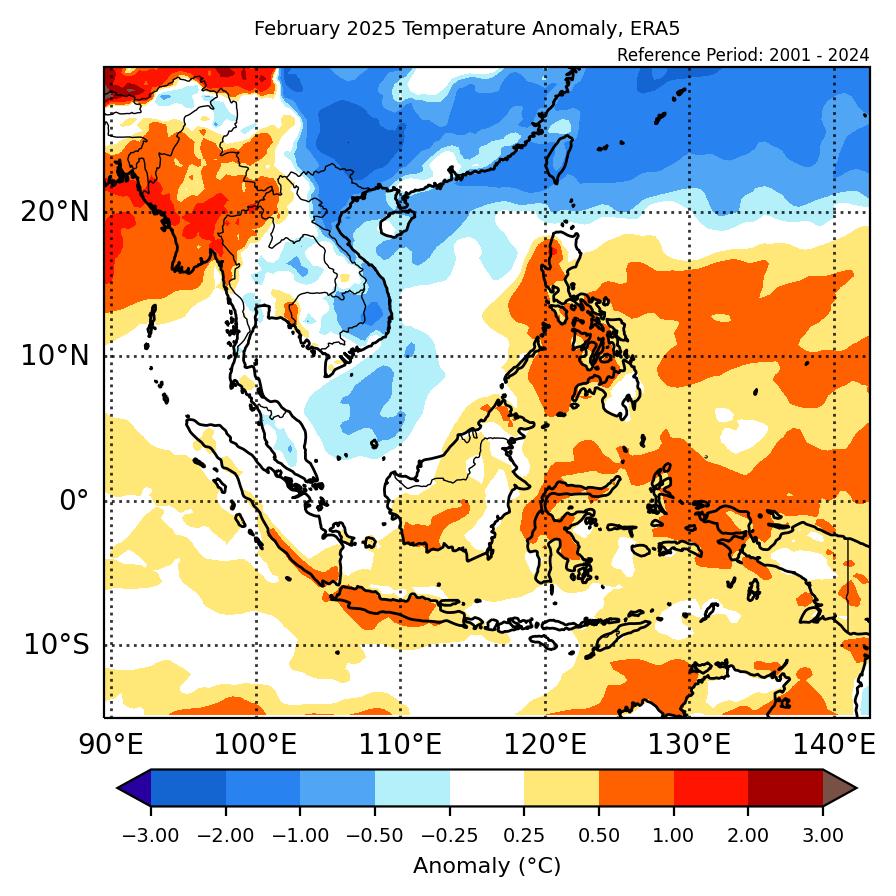
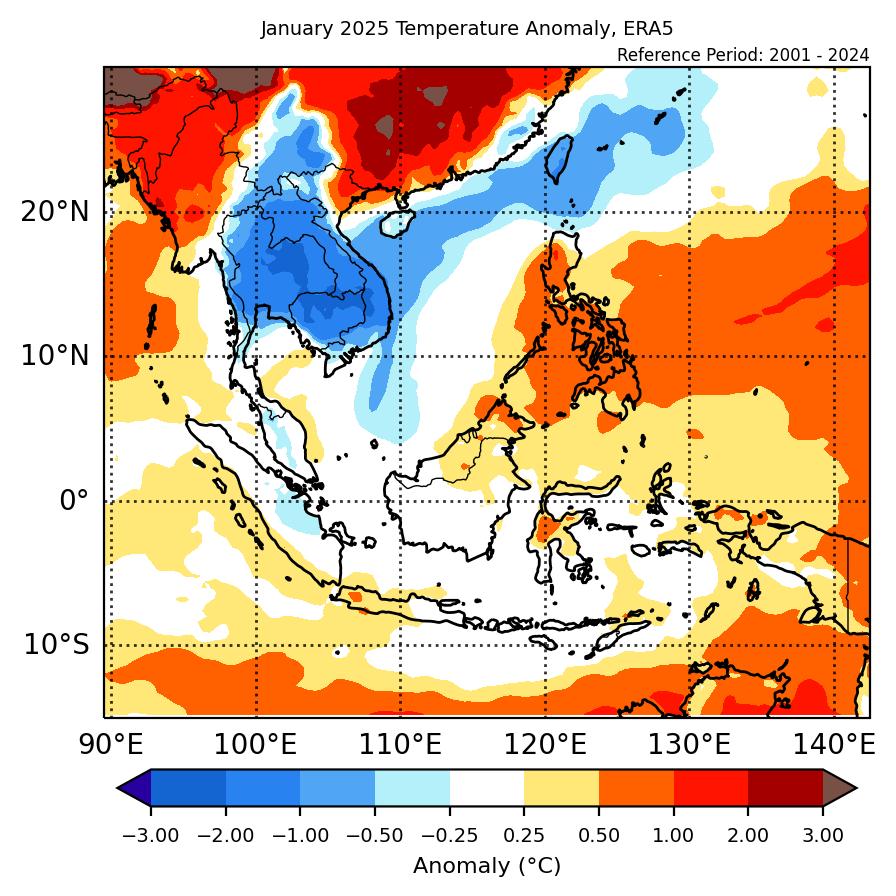
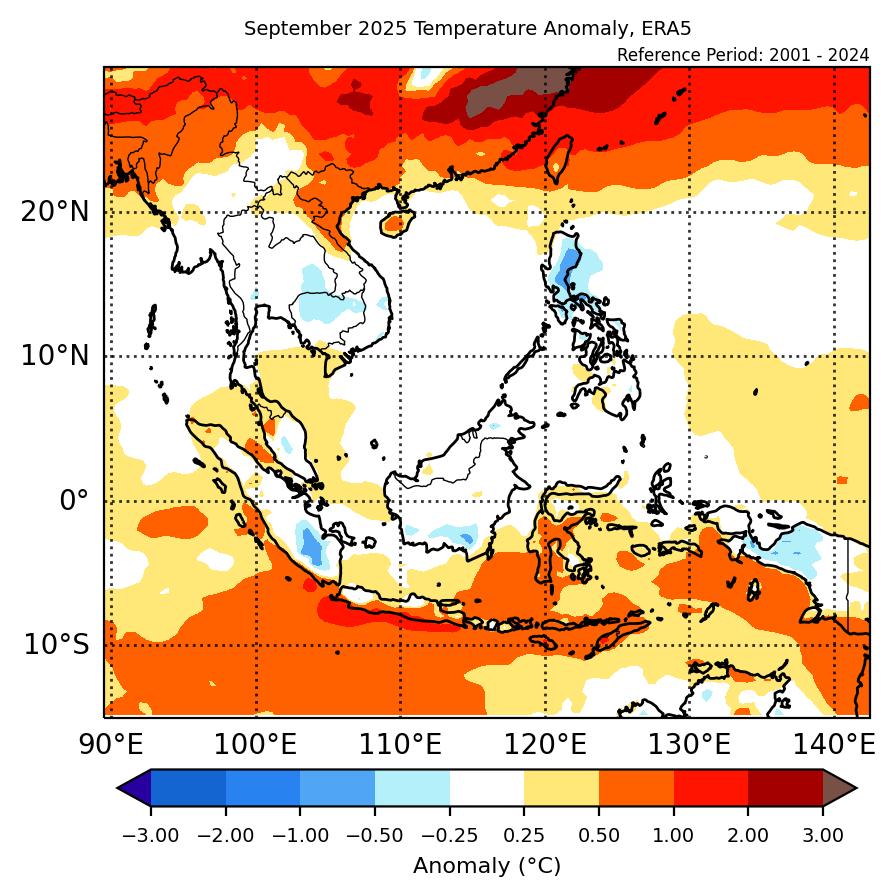
1.3 Near- to above-average temperatures were recorded over Mainland Southeast Asia in September 2025, while below- to above-average temperatures were recorded over the Maritime Continent (Figure 2). The coldest anomalies (0.5°C – 1°C below average) were recorded over southern Sumatra and northern Philippines, in line with the above-average rainfall anomalies. The warmest anomalies (0.5°C – 1°C above average) were recorded over parts of northeast and northwest Mainland Southeast Asia, as well as over Sulawesi.
2. Climate Drivers
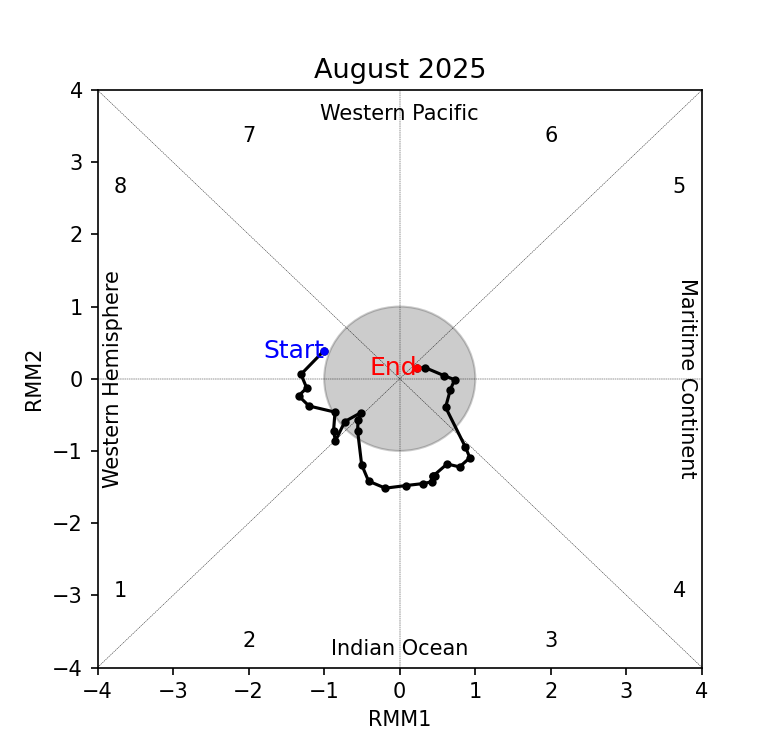
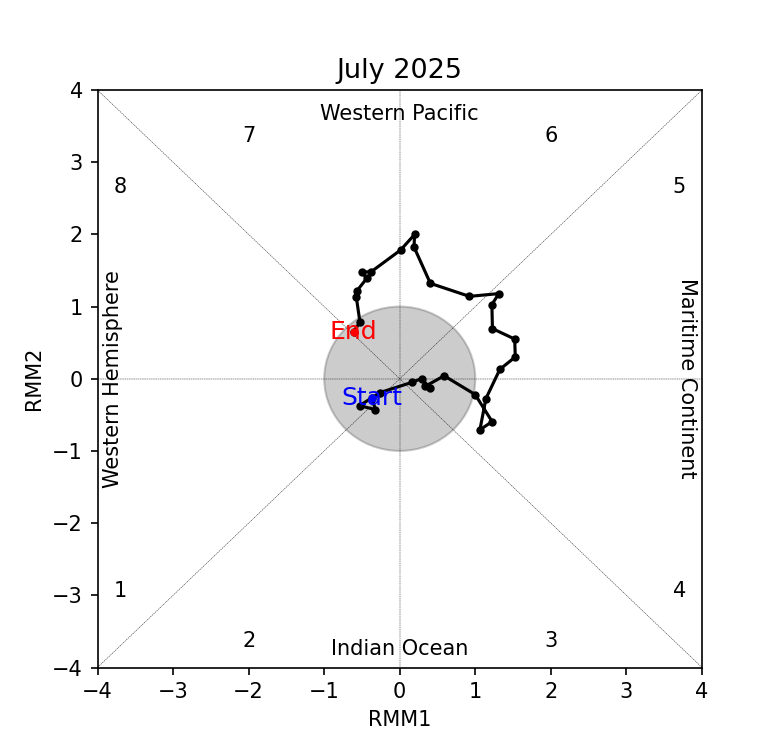
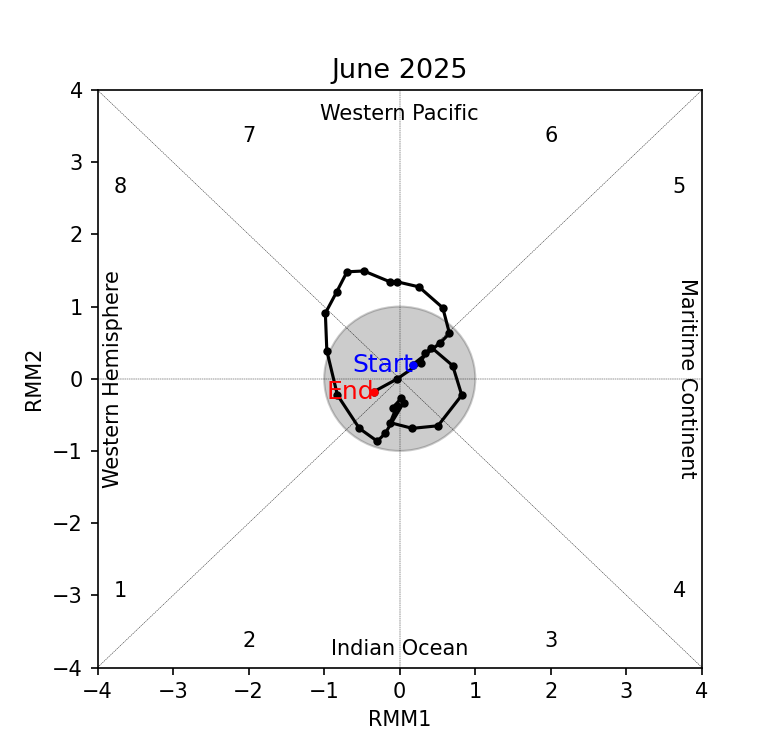
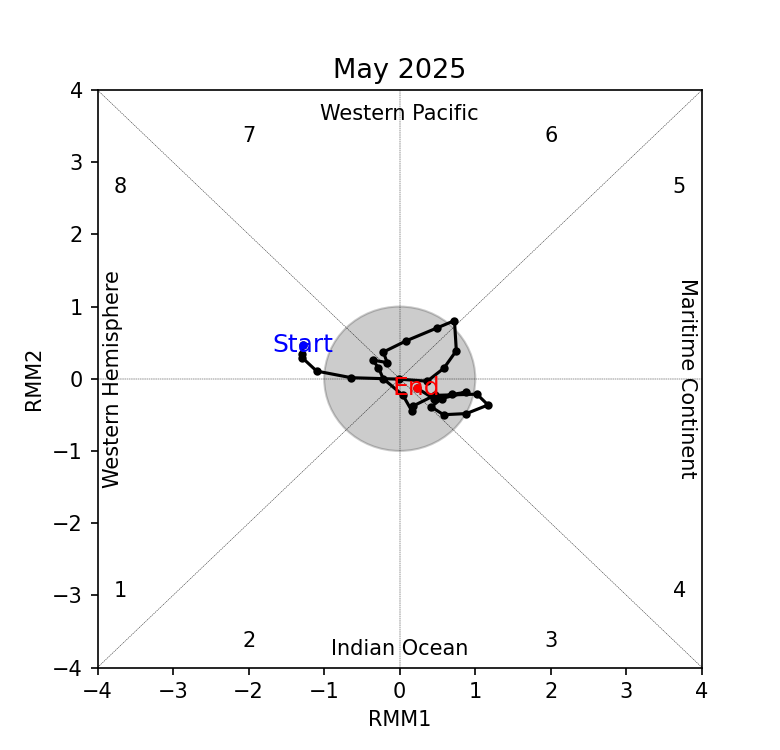
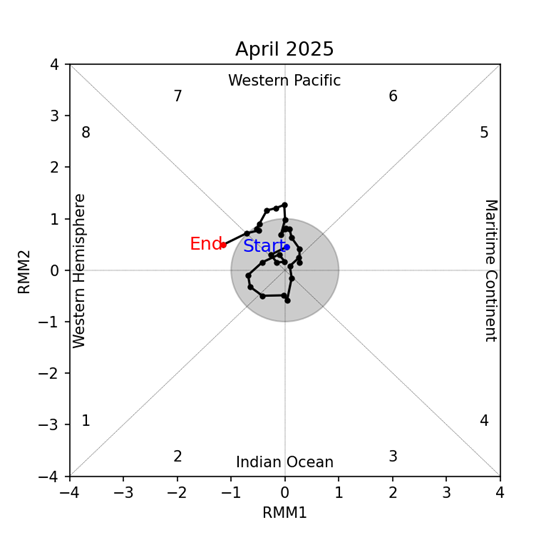
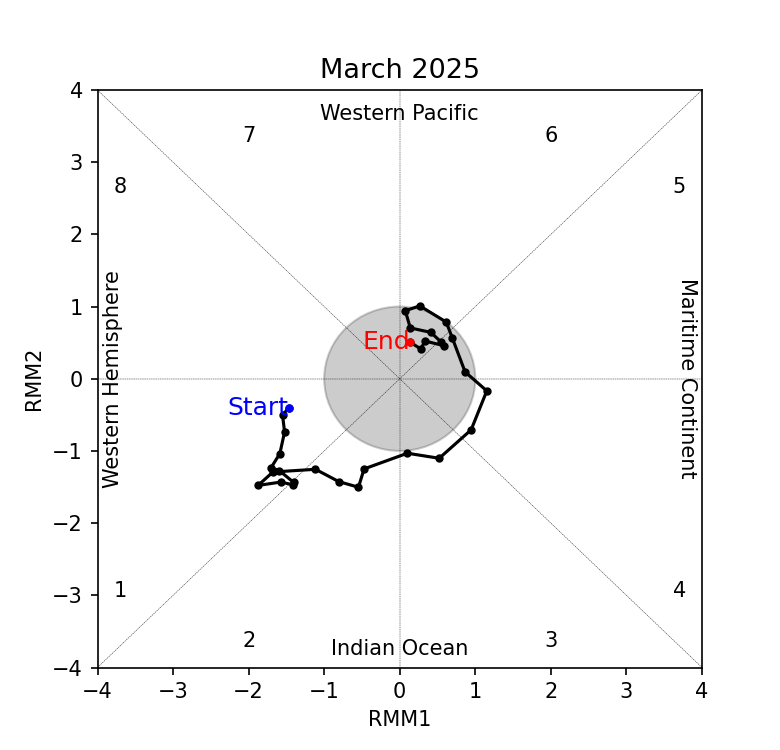
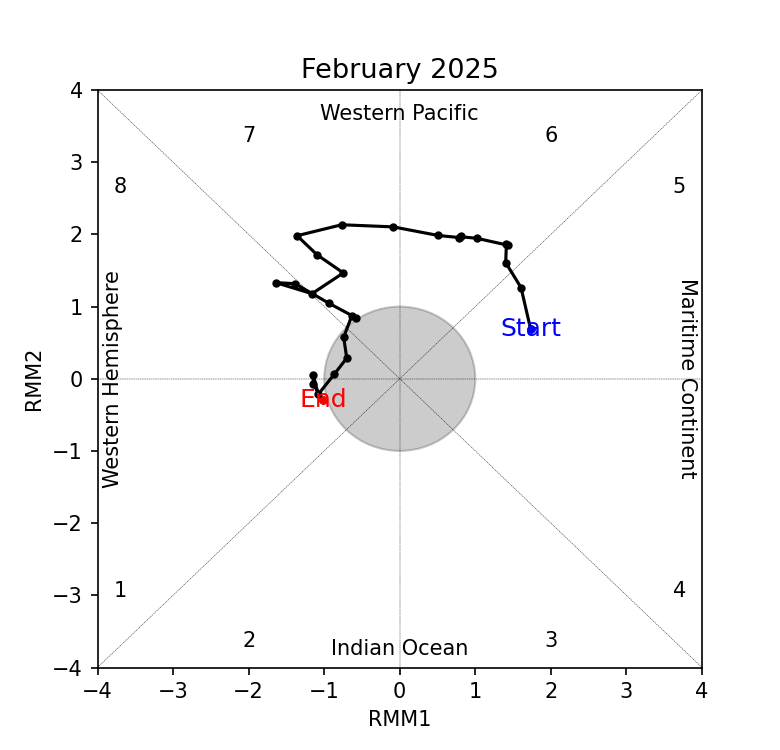
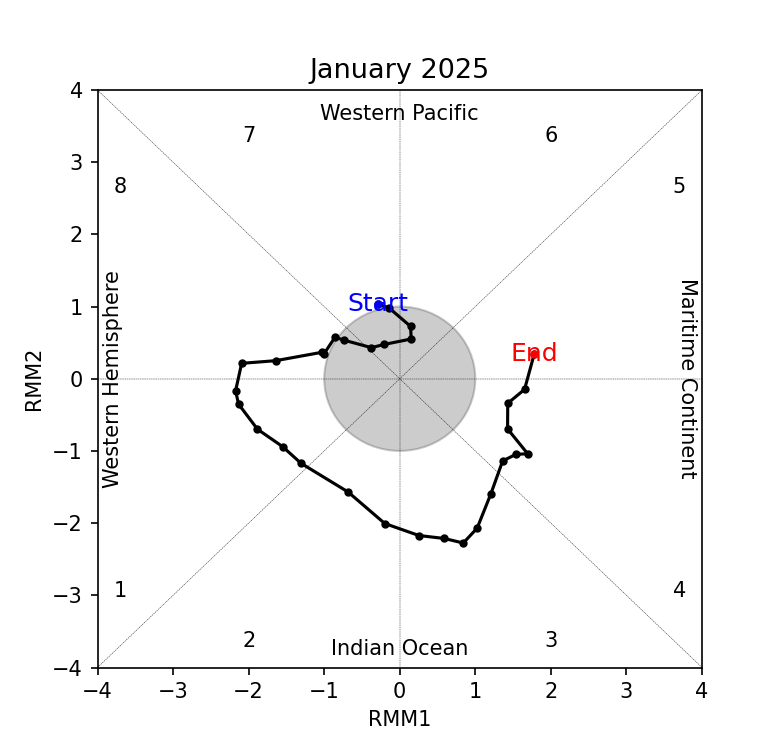
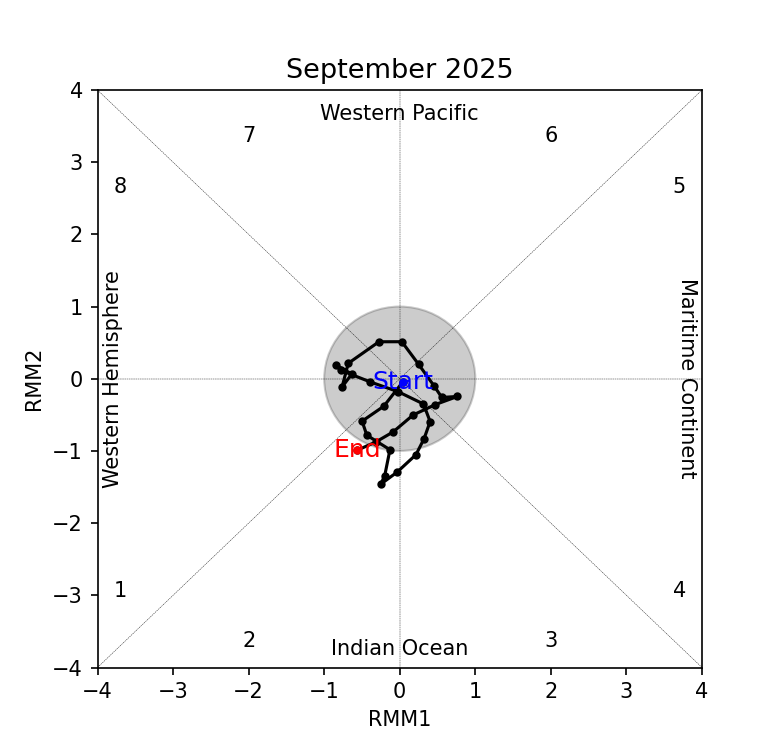
2.1 At the start of September, the Madden-Julian Oscillation (MJO) was inactive based on the RMM diagram (Figure 3). An MJO signal emerged over the Indian Ocean (Phases 2 and 3) towards the end of the first week of the month, before rapidly decaying in the middle of the second week and then remaining inactive until the end of the month. At this time of the year, Phases 2 and 3 tend to bring drier wetter conditions to the western Maritime Continent. However, these patterns are not visible in Figure 1, indicating other drivers likely had a stronger influence on the region’s rainfall.
2.2 A negative Indian Ocean Dipole (IOD) was present in September 2025. Negative IOD events tend to bring wetter conditions to parts of the region, particularly the southern Maritime Continent, in line with the positive rainfall anomalies in Figure 1.