
Review of Regional Weather for August 2026
1. Overview
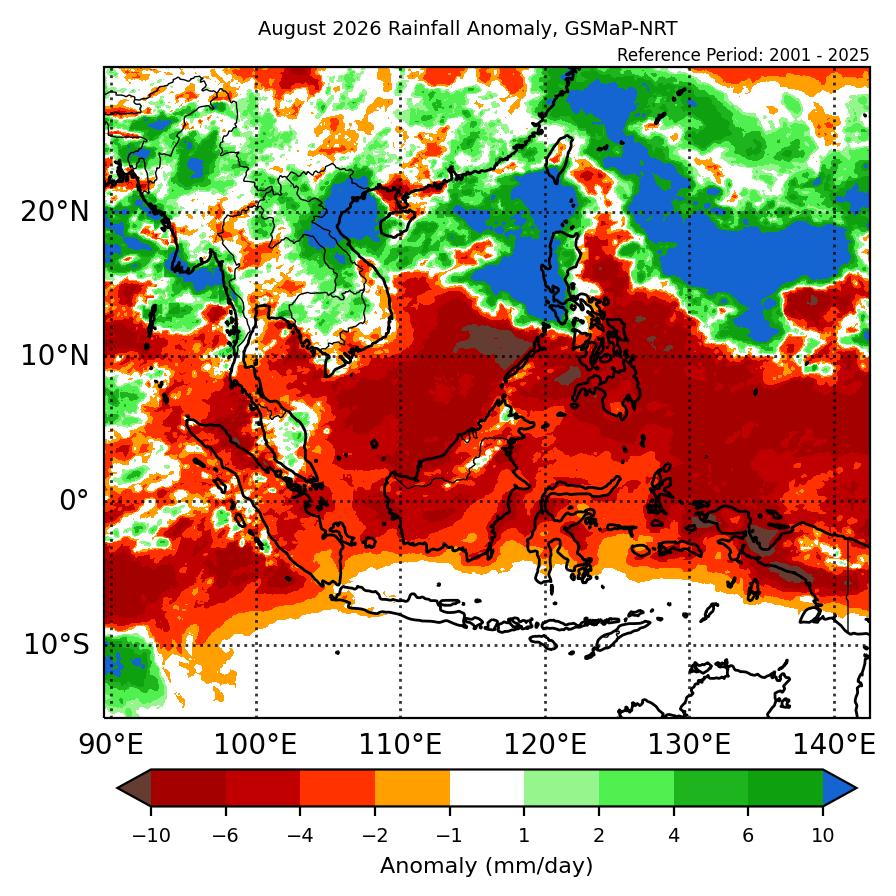
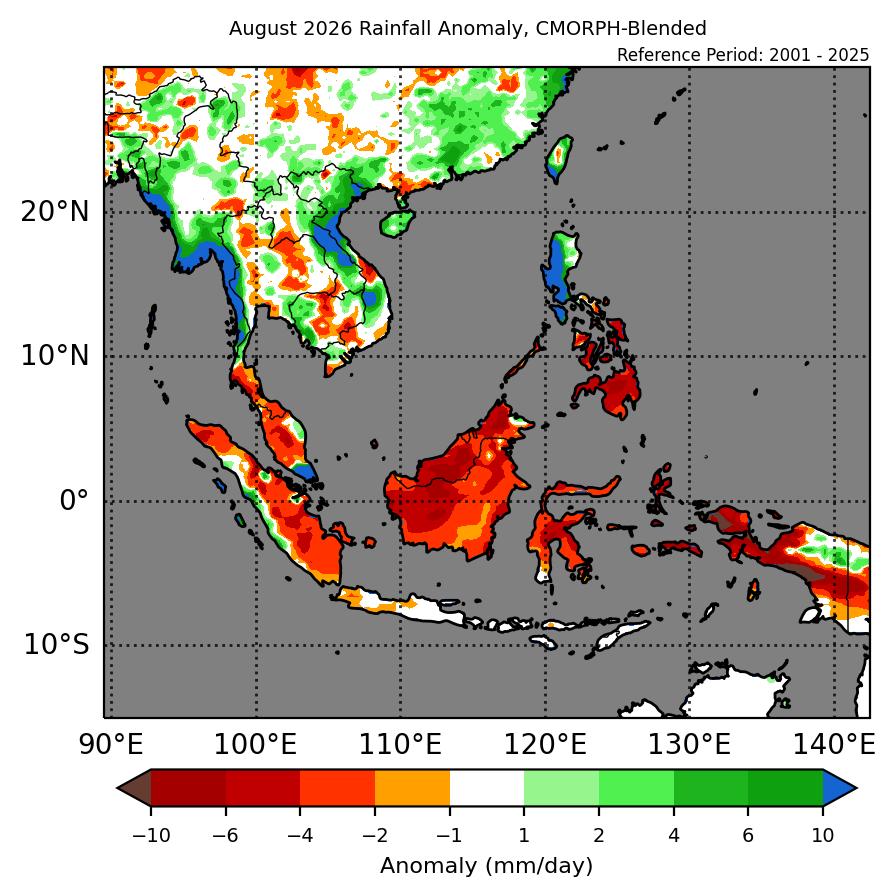
1.1 During August 2026, the southern ASEAN region recorded generally below-average rainfall, while much of the northern ASEAN region recorded above-average rainfall (Figure 1). The largest positive (wettest) anomalies were recorded over western coastal and northeastern Mainland Southeast Asia along with parts of the northern Philippines in both datasets (GSMaP-NRT and CMORPH-Blended). The largest negative (drier) anomalies were recorded over Borneo, southern Philippines and western Papua. There were some differences between the datasets, particularly over southeastern Mainland Southeast Asia where GSMaP-NRT recorded wetter conditions over most of Cambodia apart from the coast and drier conditions over southern Viet Nam, while CMORPH-Blended recorded a mix of wetter and drier conditions over both regions.
1.2 The observed rainfall anomaly pattern of above-average rainfall over the northern ASEAN region and the below-average rainfall over the southern ASEAN regions are consistent with the predictions from the subseasonal weather outlooks for August 2026 (3 – 16 August 2026 and 17 – 30 August 2026). The observations are also consistent with the seasonal outlook for August 2026, which predicted below normal rainfall over most of the southern ASEAN region and above normal rainfall over parts of the northern ASEAN region.
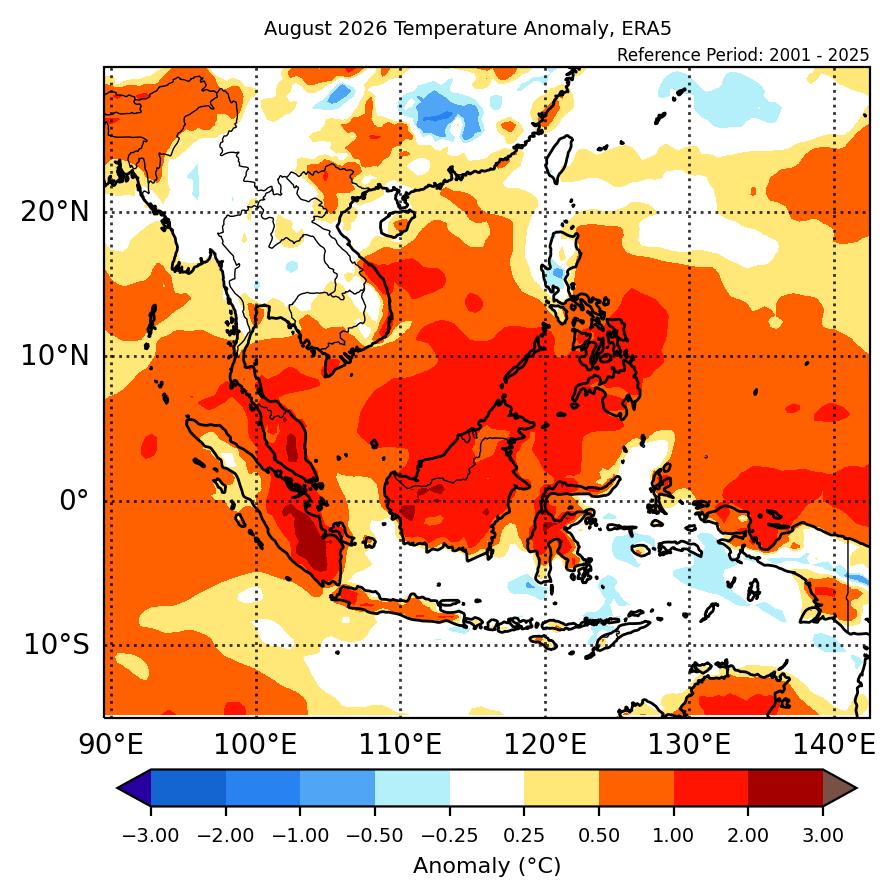
1.3 Most of the southern ASEAN region experienced above-average temperature, while much of the northern ASEAN region experienced near-average temperature (Figure 2). The warmest anomalies (2°C – 3°C above average) occurred over parts of the western Maritime Continent. Negative (cool) anomalies were only recorded in isolated areas.
2. Climate Drivers
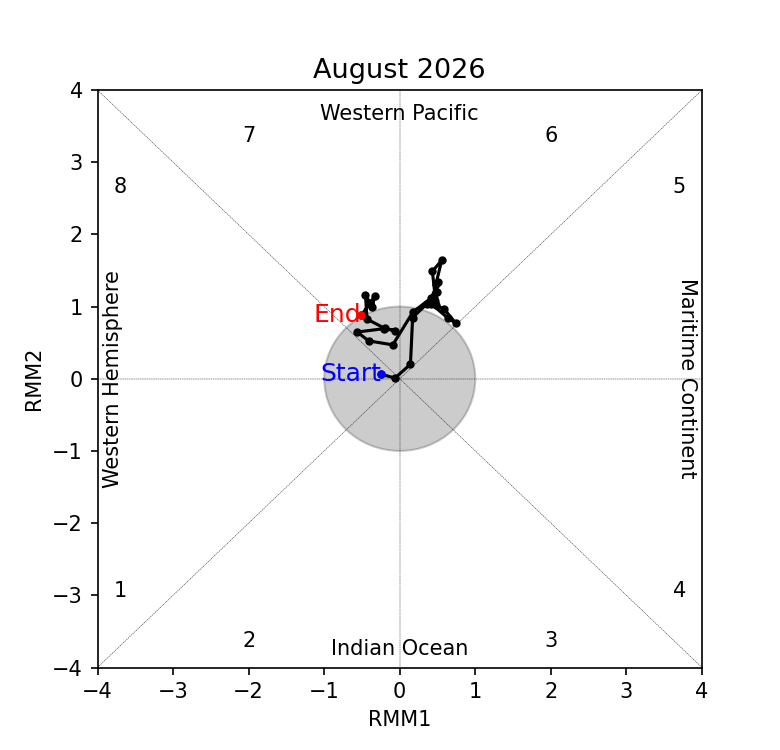
2.1 While a Madden-Julian Oscillation (MJO) signal was present over the Western Pacific (Phases 6 and 7) during much of August based on the RMM, there was little eastward propagation. This lack of clear MJO signal may be due to the strong El Niño conditions in the Pacific. Phases 6 and 7 typically bring drier conditions to the central and eastern Maritime Continent, while Phase 6 can bring wetter conditions over parts of Mainland Southeast Asia and the Philippines. This is in line with wetter conditions over the northern ASEAN region and drier conditions over the southern ASEAN region.
2.2 The El Niño conditions were present in August 2026, with the relative Nino3.4 index supporting the strength of the El Niño to be strong. El Niño conditions typically bring drier conditions to the Maritime Continent at this time of the year.