Category Archives: Fortnightly Weather Review

CR58

September 13, 2023

Review of Regional Weather for August 2023

Review of Regional Weather for August 2023


1. Overview

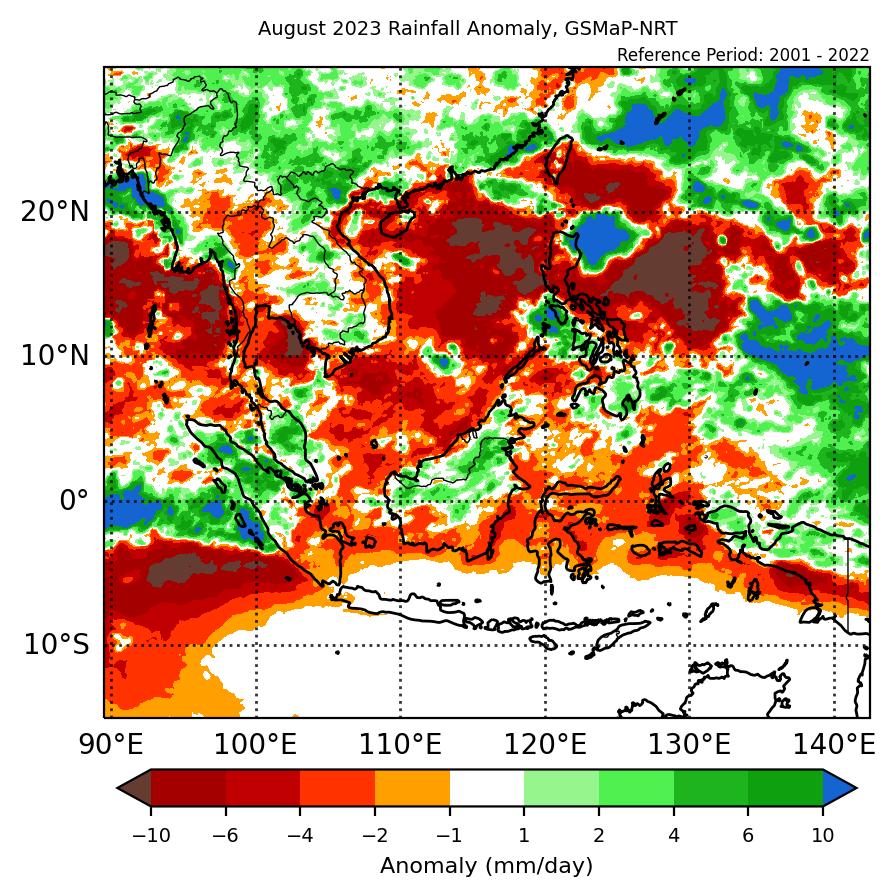
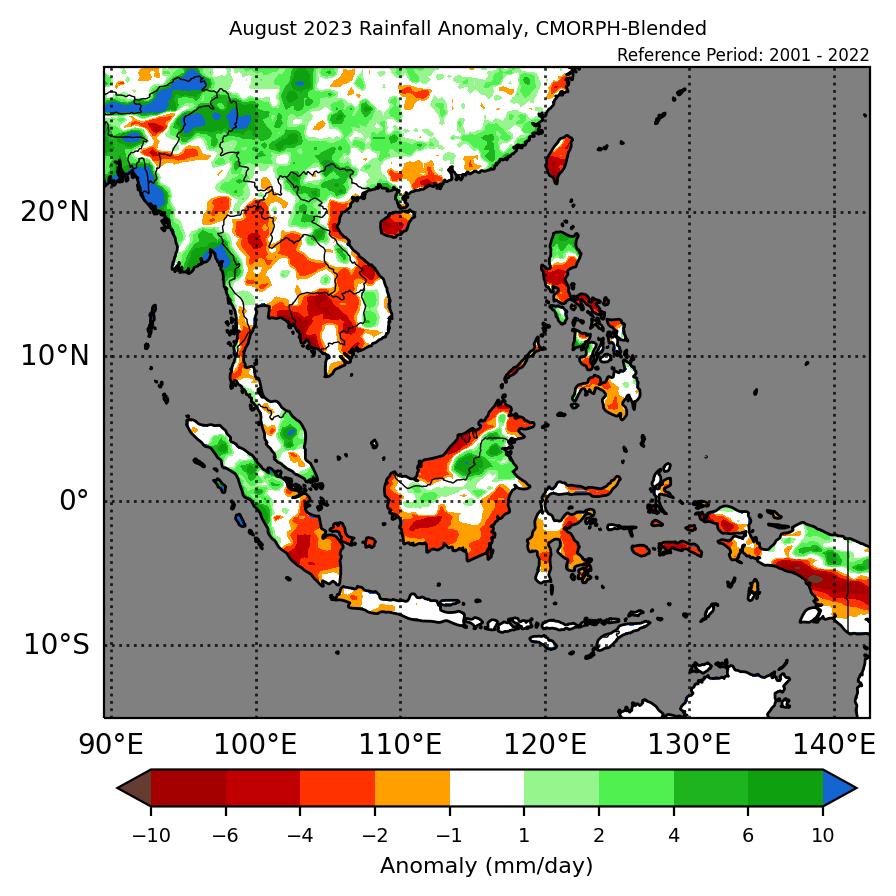
1.1 During August 2023, a mix of below- to above-average rainfall was recorded over Southeast Asia. Over Mainland Southeast Asia, below-average rainfall was recorded over central and southern parts of the region, while a mix of below- to above-average rainfall was recorded over the rest of the region. However, there was some discrepancy over Cambodia, with GSMaP-NRT indicating predominantly near- to above-average rainfall, while CMORPH-Blended indicating well below-average rainfall. Over the Maritime Continent, below-average rainfall was recorded over much of the southern half of the region, with below- to above average rainfall over much of the northern half. For Southeast Asia, the largest positive (wetter) anomalies were recorded over parts of western Myanmar for GSMaP-NRT (Figure 1, left) and CMORPH-Blended (Figure 1, right) satellite-derived rainfall estimates. The largest negative (drier) anomalies were recorded over parts of Cambodia (CMORPH-Blended) and southern Sumatra, parts of the Maluku Islands and southern Papua (both GSMaP-NRT and CMORPH-Blended).

1.2 The observed rainfall anomaly pattern of below-average rainfall over the southern half of the Maritime Continent and a mix of below- to near-average rainfall elsewhere is broadly consistent with the predictions from the subseasonal weather outlooks for August 2023 (7 – 20 August 2023 and 21 August – 3 September 2023).

era5_rainfall_anomalies
cmorph_bld_rainfall_anomalies
Figure 1: Rainfall anomalies for August 2023 based on GSMaP-NRT data (left) and CMORPH-Blended data (right). The climatological reference period is 2001-2022. Green colour denotes above-average rainfall (wetter), while orange denotes below-average rainfall (drier).


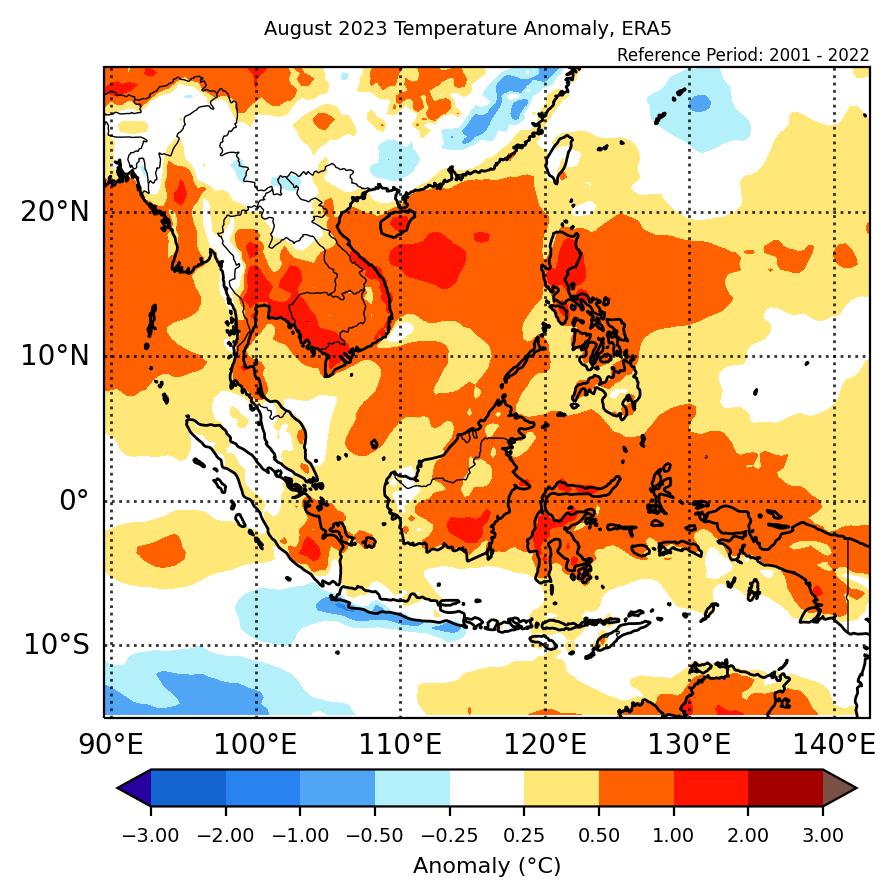
1.3 Above-average temperatures were recorded over most of Southeast Asia, apart from over northern Mainland Southeast Asia and the southern Maritime Continent where a mix of below- to above-average temperature was recorded. The warmest anomalies (more than 1°C above average) were recorded over parts of Thailand, Cambodia, central and southern Viet Nam, as well as the central equatorial region.

era5_temperature_anomalies


Figure 2: Temperature anomalies for August 2023 based on ERA-5 reanalysis. The climatological reference period is 2001-2022. Red colour denotes above-average temperature (warmer), while blue denotes below-average temperature (colder).


2. Climate Drivers

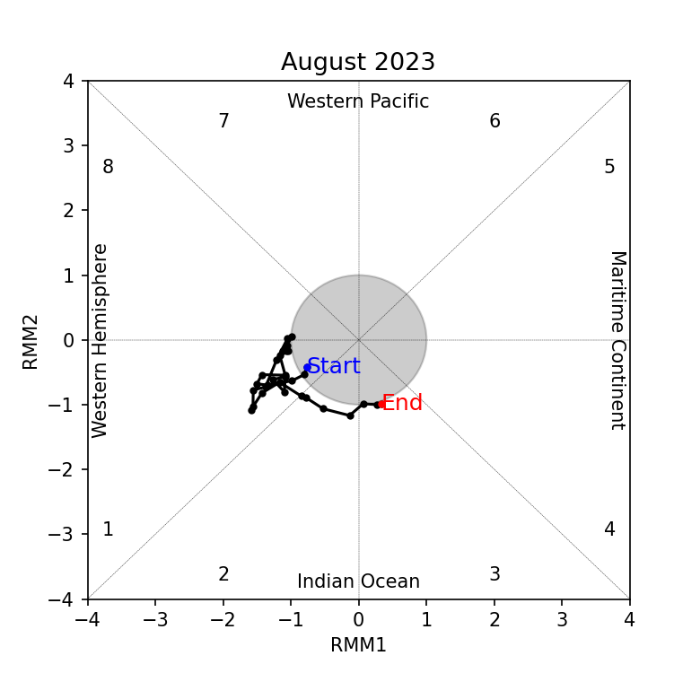
2.1 For much of August, there was no coherent Madden-Julian Oscillation (MJO) signal. While there were some indications of an MJO signal based on the RMM index, there was no eastward propagation until the last week of August. During the last week of August, based on the RMM Index, an MJO signal propagated from the Western Hemisphere (Phase 1) to the Indian Ocean (Phases 2 and 3). Typically for August, Phases 1 and 2 tend to bring drier conditions to northeastern Southeast Asia, while Phases 2 and 3 bring wetter conditions to the western Maritime Continent.

mjo_phase_diagram


Figure 3: The MJO phase diagram. The diagram illustrates the movement of the MJO through different phases, which correspond to different locations along the equator (denoted in the text with the first day of the month in blue and the last day of the month in red). The distance of the index from the centre of the diagram is related to the strength of the MJO. Values within the grey circle are considered weak or indiscernible (data from the Bureau of Meteorology, Australia).


2.2 El Niño conditions were present during August 2023. Sea surface temperatures in the Nino3.4 region (used to monitor ENSO) were consistent with El Niño conditions, with signs of El Niño-like response in key atmospheric indicators. El Niño events tend to bring drier-than-average conditions to much of the Maritime Continent during the June to August period.


August 18, 2023

Review of Regional Weather for July 2023

Review of Regional Weather for July 2023


1. Overview

1.1 During July 2023, a mix of below- to above-average rainfall was recorded over Southeast Asia. Over Mainland Southeast Asia, below-average rainfall was recorded over the northeastern parts of the region, while a mix of below- to above-average rainfall was recorded over the rest of the region. However, there was some discrepancy over Cambodia, with GSMaP-NRT indicating predominantly above-average rainfall, while CMORPH-Blended indicating well below-average rainfall. Over the Maritime Continent, above-average rainfall was recorded over much of the western half of the region, with below-average rainfall over much of the eastern half. The largest positive (wetter) anomalies were recorded over parts of southern Myanmar, southern Viet Nam, and northern Philippines for GSMaP-NRT (Figure 1, left) and CMORPH-Blended (Figure 1, right) satellite-derived rainfall estimates. The largest negative (drier) anomalies were recorded over parts of Papua (CMORPH-Blended) and northern Viet Nam and coastal Myanmar (both GSMaP-NRT and CMORPH-Blended).

1.2 The observed rainfall anomaly pattern of a mix of below- to near-average rainfall over the ASEAN region is broadly consistent with the predictions from the subseasonal weather outlooks for July 2023 (26 June – 9 July 2023, 10 – 23 July 2023 and 24 July – 6 August 2023).

era5_rainfall_anomalies
cmorph_bld_rainfall_anomalies
Figure 1: Rainfall anomalies for July 2023 based on GSMaP-NRT data (left) and CMORPH-Blended data (right). The climatological reference period is 2001-2022. Green colour denotes above-average rainfall (wetter), while orange denotes below-average rainfall (drier).


1.3 The observed rainfall anomaly pattern of a mix of below- to near-average rainfall over the ASEAN region is broadly consistent with the predictions from the subseasonal weather outlooks for July 2023 (26 June – 9 July 2023, 10 – 23 July 2023, and 24 July – 6 August).

era5_temperature_anomalies


Figure 2: Temperature anomalies for July 2023 based on ERA-5 reanalysis. The climatological reference period is 2001-2022. Red colour denotes above-average temperature (warmer), while blue denotes below-average temperature (colder).


2. Climate Drivers

2.1 At the start of July, the Madden-Julian Oscillation (MJO) signal was present over the Indian Ocean (Phase 2). This signal decayed during the first week of July, with no significant MJO activity for the rest of the month. Typically for June, Phase 2 tends to bring drier conditions in northern Southeast Asia and bring wetter conditions to the western Maritime Continent (somewhat discernible in Figure 1).

mjo_phase_diagram


Figure 3: The MJO phase diagram. The diagram illustrates the movement of the MJO through different phases, which correspond to different locations along the equator (denoted in the text with the first day of the month in blue and the last day of the month in red). The distance of the index from the centre of the diagram is related to the strength of the MJO. Values within the grey circle are considered weak or indiscernible (data from the Bureau of Meteorology, Australia).


2.2 El Niño conditions were likely present during July 2023. Sea surface temperatures in the Nino3.4 region (used to monitor ENSO) were consistent with El Niño conditions, with some signs of El Niño-like response in some of the key atmospheric indicators (cloudiness). El Niño events tend to bring drier-than-average conditions to much of the Maritime Continent during the June to August period.


July 14, 2023

Review of Regional Weather for June 2023

Review of Regional Weather for June 2023


1. Overview
1.1 During June 2023, a mix of below- to above-average
rainfall was recorded over the ASEAN region. Over Mainland Southeast Asia,
above-average rainfall was recorded in the eastern parts of the region, while
a mix of below- to above-average rainfall was recorded over the rest of the
region. Over the Maritime Continent, above-average rainfall was recorded over
the western Maritime Continent, with a mix of below- to above-average rainfall
elsewhere. The largest positive anomalies were over northeastern Borneo for
both the GSMaP-NRT (Figure 1, left) and CMORPH-Blended (Figure 1, right)
satellite-derived rainfall estimates.1.2 The observed rainfall anomaly pattern of below- to
near-average rainfall over the ASEAN region is broadly consistent with the
predictions from the subseasonal weather outlooks for June 2023 (29 May – 11 June 2023</a >,
12 – 25 June 2023</a >
and
26 June – 9 July 2023</a >).

era5_rainfall_anomalies
cmorph_bld_rainfall_anomalies
Figure 1: Rainfall anomalies for June 2023 based on GSMaP-NRT data
(left) and CMORPH-Blended data (right). The climatological reference
period is 2001-2022. Green colour denotes above-average rainfall
(wetter), while orange denotes below-average rainfall (drier).


1.3 Above-average temperatures were recorded over most of
Mainland Southeast Asia, with near- to above-average temperature over most of
the Maritime Continent. Near- to below-average temperatures were recorded over
the southern Maritime Continent. The warmest anomalies (more than 2 °C
above-average) were recorded over southern parts of the Malay Peninsula, Lao
PDR and northeast Thailand.

era5_temperature_anomalies
Figure 2: Temperature anomalies for June 2023 based on ERA-5 reanalysis.
The climatological reference period is 2001-2022. Red colour denotes
above-average temperature (warmer), while blue denotes below-average
temperature (colder).


2. Climate Drivers

2.1 A Madden-Julian Oscillation (MJO) was active at the start
of June 2023. An MJO signal propagated eastwards from the Western Hemisphere
and Africa (Phase 1) and to the Indian Ocean (Phases 2 and 3) in the first
half of June. In Week 3, the MJO signal weakened and became insignificant. An
MJO signal re-emerged in Week 4 over the Western Hemisphere and Africa (Phase
1) and propagated eastwards to the Indian Ocean (Phase 2). Typically for June,
Phases 1 and 2 tends to bring drier conditions in northern Southeast Asia
while Phases 2 and 3 tend to bring wetter conditions to the western Maritime
Continent.

mjo_phase_diagram
Figure 3: The MJO phase diagram. The diagram illustrates the movement of
the MJO through different phases, which correspond to different
locations along the equator (denoted in the text with the first day of
the month in blue and the last day of the month in red). The distance of
the index from the centre of the diagram is related to the strength of
the MJO. Values within the grey circle are considered weak or
indiscernible (data from the Bureau of Meteorology, Australia).


2.2 Over the past month, there have been signs of El
Niño-like conditions. El Niño sea surfaces temperatures indices are near or
exceeding El Niño thresholds, whereas key atmospheric indicators (cloudiness
and wind anomalies) displayed neutral conditions for most of June.


June 21, 2023

Review of Regional Weather for May 2023

Review of Regional Weather for May 2023


1. Overview
1.1 During May 2023, below- to near-average rainfall was
recorded over much of Mainland Southeast Asia, with a mix of below- to
above-average rainfall over the Maritime Continent. Over Mainland Southeast
Asia, below-average rainfall was recorded over most of the central and
southern part of the region with the largest negative anomalies (drier
conditions) over southern Myanmar and southern Thailand. Elsewhere in Mainland
Southeast Asia, the rainfall was below- to near-average. Over the Maritime
Continent, the largest positive anomalies (wetter conditions) were recorded
over eastern Borneo with the largest negative anomalies over parts of western
Borneo for both the GSMaP-NRT (Figure 1, left) and CMORPH-Blended (Figure 1,
right) satellite-derived rainfall estimates.

1.2 The observed rainfall anomaly pattern of below- to
near-average rainfall over Mainland Southeast Asia, and no widespread regional
anomalies over the Maritime Continent, is broadly consistent with the
predictions from the subseasonal weather outlooks for May 2023 (1 – 14 May 2023
and
15 – 28 May 2023).

era5_rainfall_anomalies
cmorph_bld_rainfall_anomalies
Figure 1: Rainfall anomalies for May 2023 based on GSMaP-NRT data
(left) and CMORPH-Blended data (right). The climatological reference
period is 2001-2022. Green colour denotes above-average rainfall
(wetter), while orange denotes below-average rainfall (drier).


1.3 Above-average temperatures were recorded over most of
Mainland Southeast Asia, with near- to above-average temperature over most of
the Maritime Continent. Near- to below-average temperatures were recorded over
the southern Maritime Continent. The warmest anomalies (more than 2 °C
above-average) were recorded over southern parts of the Malay Peninsula, Lao
PDR and northeast Thailand.

era5_temperature_anomalies
 

Figure 2: Temperature anomalies for May 2023 based on ERA-5 reanalysis.
The climatological reference period is 2001-2022. Red colour denotes
above-average temperature (warmer), while blue denotes below-average
temperature (colder).


2. Climate Drivers

2.1 The Madden-Julian Oscillation (MJO) was active during May
2023. An MJO signal propagated eastwards from the Maritime Continent (Phase
4), reaching the Western Pacific (Phases 6 and 7) during third week of May,
and then the Western Hemisphere (Phase 8) at the end of the month. Typically
for May, Phase 4 brings wetter conditions to much of the Maritime Continent,
and Phase 5 tends to bring wetter conditions to the eastern Maritime
Continent. Phase 6 tends to bring drier conditions to the western half of the
Maritime Continent. Phases 7 and 8 bring drier conditions to much of Southeast
Asia.

mjo_phase_diagram
 

Figure 3: The MJO phase diagram. The diagram illustrates the movement of
the MJO through different phases, which correspond to different
locations along the equator (denoted in the text with the first day of
the month in blue and the last day of the month in red). The distance of
the index from the centre of the diagram is related to the strength of
the MJO. Values within the grey circle are considered weak or
indiscernible (data from the Bureau of Meteorology, Australia).


2.2 The tropical Pacific was likely in an ENSO neutral state
during May. The sea surface temperatures in the Nino3.4 region (used to
monitor ENSO) continued to warm, although on average were still within the
neutral range. Atmospheric indicators over the tropical Pacific Ocean
indicated neutral conditions.


May 16, 2023

Review of Regional Weather for April 2023

Review of Regional Weather for April 2023


1. Overview

1.1 During April 2023, below- to near-average rainfall was recorded over Mainland Southeast Asia, with a mix of below- to above-average rainfall over the Maritime Continent. Over Mainland Southeast Asia, below-average rainfall was recorded over most of the central and southern part of the region with the largest negative anomalies (drier conditions) over southern Thailand. Elsewhere in Mainland Southeast Asia, the rainfall was near-average. Over the Maritime Continent, the largest positive anomalies (wetter conditions) were recorded over southern Sumatra with the largest negative anomalies over parts of Borneo for both the GSMaP-NRT (Figure 1, left) and CMORPH-Blended (Figure 1, right) satellite-derived rainfall estimates.

1.2 The observed rainfall anomaly pattern of below- to near-average rainfall over Mainland Southeast Asia, below-average rainfall over central Maritime Continent , and no widespread regional anomalies elsewhere over the Maritime Continent, is broadly consistent with the predictions from the subseasonal weather outlooks for April 2023 (3 – 16 April 2023 and 17 – 30 April 2023).

era5_rainfall_anomalies
cmorph_bld_rainfall_anomalies
Figure 1: Rainfall anomalies for April 2023 based on GSMaP-NRT data (left) and CMORPH-Blended data (right). The climatological reference period is 2001-2022. Green colour denotes above-average rainfall (wetter), while orange denotes below-average rainfall (drier).


1.3 Above-average temperatures were recorded over most of Mainland Southeast Asia, with near- to above-average temperature over most of the Maritime Continent. The warmest anomalies (more than 2 °C above-average) were recorded over parts of Lao PDR and northern Thailand.

era5_temperature_anomalies


Figure 2: Temperature anomalies for April 2023 based on ERA-5 reanalysis. The climatological reference period is 2001-2022. Red colour denotes above-average temperature (warmer), while blue denotes below-average temperature (colder).


2. Climate Drivers

2.1 The Madden-Julian Oscillation (MJO) was active during April 2023. An MJO signal propagated eastwards from the Maritime Continent (Phase 5), reaching the Western Hemisphere (Phases 8 and 1) during third week of April, and then just entering again the Maritime Continent (Phase 4) at the end of the month. Typically for April, Phases 7, 8, and 1 bring drier conditions to the Southeast Asia, while Phases 3 to 5 bring wetter conditions, particularly in southern Southeast Asia.

mjo_phase_diagram
Figure 3: The MJO phase diagram. The diagram illustrates the movement of the MJO through different phases, which correspond to different locations along the equator (denoted in the text with the first day of the month in blue and the last day of the month in red). The distance of the index from the centre of the diagram is related to the strength of the MJO. Values within the grey circle are considered weak or indiscernible (data from the Bureau of Meteorology, Australia).


2.2 The tropical Pacific was in an ENSO neutral state during April. Overall, sea surface temperatures in the Nino3.4 region (used to monitor ENSO) and the atmospheric indicators over the tropical Pacific Ocean indicated neutral conditions.


April 13, 2023

Review of Regional Weather for March 2023

Review of Regional Weather for March 2023


1. Overview

1.1 During March 2023, a mix of below- to above-average rainfall was recorded over much of the Maritime Continent. Parts of the northern Maritime Continent, including Philippines and northeastern Borneo, received below- to near-average rainfall, while parts of the equatorial region received above-average rainfall. Over Mainland Southeast Asia, near-average rainfall was recorded over most of northwestern and eastern region, and below-normal elsewhere. The largest positive anomalies (wetter conditions) were recorded over the central parts of Borneo for both the GSMaP-NRT (Figure 1, left) and CMORPH-Blended (Figure 1, right) satellite-derived rainfall estimates. The largest negative anomalies (drier conditions) were recorded over parts of southern Sumatra and Sulawesi in both CMORPH-Blended data and GSMaP-NRT data.

1.2 The observed rainfall anomaly pattern of a mix of below- to above-average rainfall for the Maritime Continent and below- to near-average rainfall for Mainland Southeast Asia are broadly consistent with the predictions from the subseasonal weather outlooks for March 2023 (6 – 19 March 2023 and 20 March – 2 April 2023).

era5_rainfall_anomalies
cmorph_bld_rainfall_anomalies
Figure 1: Rainfall anomalies for March 2023 based on GSMaP-NRT data (left) and CMORPH-Blended data (right). The climatological reference period is 2001-2022. Green colour denotes above-average rainfall (wetter), while orange denotes below-average rainfall (drier).


1.3 Below- to near-average temperatures were recorded over much of the western and central Maritime Continent, with above-average temperatures over parts of the eastern Maritime Continent. A mix of below- to above-average temperatures were recorded over the northern and central Mainland Southeast Asia and predominantly below-average temperatures were observed over southeastern Mainland Southeast Asia. The warmest anomalies were recorded over northern Viet Nam, and the coolest over the southeastern Mainland Southeast Asia.

era5_temperature_anomalies


Figure 2: Temperature anomalies for March 2023 based on ERA-5 reanalysis. The climatological reference period is 2001-2022. Red colour denotes above-average temperature (warmer), while blue denotes below-average temperature (colder).


2. Climate Drivers

2.1 A Madden-Julian Oscillation (MJO) signal was present over the Western Pacific (Phase 6) at the start of March. This MJO signal propagated eastwards and strengthened as it passed through the Western Pacific (Phase 7) and Western Hemisphere (Phases 8 and 1) in the first half of March. In the second half of March, this signal relatively weakened and continued propagating eastwards through the Western Pacific (Phase 1) and Indian Ocean (Phases 2 and 3). The MJO signal weakened at the end of month and became indiscernible over the Maritime Continent (Phase 4), based on the RMM Index. Typically, during this time of the year, Phase 6 tends to bring wetter conditions to eastern Maritime Continent, while 7 and 8 tends to bring drier conditions to much of the Maritime Continent. Phases 1 and 2 tends to bring drier conditions over the eastern Maritime Continent, whereas Phase 3 tends to bring wetter conditions to the western Maritime Continent. Phase 4 usually brings wetter conditions to much of the Maritime Continent.

mjo_phase_diagram


Figure 3: The MJO phase diagram. The diagram illustrates the movement of the MJO through different phases, which correspond to different locations along the equator (denoted in the text with the first day of the month in blue and the last day of the month in red). The distance of the index from the centre of the diagram is related to the strength of the MJO. Values within the grey circle are considered weak or indiscernible (data from the Bureau of Meteorology, Australia).


2.2 La Niña conditions have now ended, and the tropical Pacific is now in an ENSO neutral state. Overall, sea surface temperatures in the Nino3.4 region (used to monitor ENSO) and the atmospheric and oceanic indicators over the tropical Pacific Ocean, indicate neutral conditions.


March 16, 2023

Review of Regional Weather for February 2023

Review of Regional Weather for February 2023


1. Overview

1.1 During February 2023, a mix of below- to above-average rainfall was recorded over the Maritime Continent. The northern half of the Maritime Continent received predominantly near- to above-average rainfall, and the southern half received predominantly below-average rainfall although some above-average rainfall was recorded in the southern most parts (Figure 1). Over Mainland Southeast Asia, near-average rainfall was recorded over most of region. The largest positive anomalies (wetter conditions) were recorded over the Malay Peninsula for both the GSMaP-NRT (Figure 1, left) and CMORPH-Blended (Figure 1, right) satellite-derived rainfall estimates. The largest negative anomalies (drier conditions) were recorded over parts of southern Sumatra and Sulawesi, with CMORPH-Blended data showing relatively drier anomalies as compared to GSMaP-NRT data.

1.2 The observed rainfall anomaly pattern of a mix of below- to above-average rainfall for the Maritime Continent (with much of above-average rainfall in the northern Maritime Continent and below-average rainfall in the southern part) and near-average rainfall for Mainland Southeast Asia are broadly consistent with the predictions from the subseasonal weather outlooks for February 2023 (6 – 19 February 2023 and 20 February – 5 March 2023).

era5_rainfall_anomalies
cmorph_bld_rainfall_anomalies
Figure 1: Rainfall anomalies for February 2023 based on GSMaP-NRT data (left) and CMORPH-Blended data (right). The climatological reference period is 2001-2022. Green colour denotes above-average rainfall (wetter), while orange denotes below-average rainfall (drier).


1.3 Warmer-than-average temperatures were recorded over northern Mainland Southeast Asia and parts of eastern Maritime Continent. Near- to below-average temperatures were observed over parts of southern Mainland Southeast Asia and around the Malay Peninsula. Elsewhere in the ASEAN region, near-average temperatures were observed. The warmest anomalies were recorded over northern Myanmar and northern Viet Nam, and the coolest over the southeastern Mainland Southeast Asia.

era5_temperature_anomalies


Figure 2: Temperature anomalies for February 2023 based on ERA-5 reanalysis. The climatological reference period is 2001-2022. Red colour denotes above-average temperature (warmer), while blue denotes below-average temperature (colder).


2. Climate Drivers

2.1 A Madden-Julian Oscillation (MJO) signal was present over the Indian Ocean (Phase 3) at the start of February. This MJO signal propagated eastwards through the Maritime Continent (Phases 4 and 5) in the first half of February and reached the Western Pacific (Phases 6 and 7) by the end of Week 2. The signal continued propagating eastwards before weakening from the middle of Week 3 over the Western Pacific (Phase 7) and becoming indiscernible at the end of the month, based on the RMM Index. Typically, during this time of the year, Phase 3 tends to bring wetter conditions to the western Maritime Continent, Phases 4 and 5 tends to bring wetter conditions to the Maritime Continent. Phase 6 tends to bring wetter conditions to eastern Maritime Continent while 7 tends to bring drier conditions to the western Maritime Continent.

mjo_phase_diagram


Figure 3: The MJO phase diagram. The diagram illustrates the movement of the MJO through different phases, which correspond to different locations along the equator (denoted in the text with the first day of the month in blue and the last day of the month in red). The distance of the index from the centre of the diagram is related to the strength of the MJO. Values within the grey circle are considered weak or indiscernible (data from the Bureau of Meteorology, Australia).


2.2 La Niña conditions were present over the tropical Pacific but have weakened since December 2022. Although overall, sea surface temperatures in the Nino3.4 region (used to monitor ENSO) and the atmospheric indicators over the tropical Pacific Ocean, continued to indicate La Niña conditions. La Niña events tend to bring wetter-than-average conditions to much of the Maritime Continent during the December to February period.


February 16, 2023

Review of Regional Weather for January 2023

Review of Regional Weather for January 2023


1. Overview

1.1 During January 2023, a mix of below- to above-average rainfall was recorded over the Maritime Continent, with much of the northern half of the region receiving above-average rainfall, and the much of the southern half receiving below-average rainfall (Figure 1). Near-average rainfall was recorded over most of Mainland Southeast Asia, except for parts of eastern Mainland Southeast Asia where above-average rainfall was recorded. The largest positive anomalies (wetter conditions) were recorded over the northeastern Maritime Continent for both the GSMaP-NRT (Figure 1, left) and CMORPH-Blended (Figure 1, right) satellite-derived rainfall estimates, along with parts of the western Maritime Continent for GSMaP-NRT. The largest negative anomalies (drier conditions) were recorded over parts of southern Borneo, southern Sulawesi, and Java, with CMORPH-Blended data showing relatively drier anomalies as compared to GSMaP-NRT data.

1.2 The observed rainfall anomaly pattern of a mix of below- to above-average rainfall for the Maritime Continent and the above-average rainfall for eastern Mainland Southeast Asia are broadly consistent with the predictions from the subseasonal weather outlooks for January 2023 (26 December 2022 – 8 January 2023, 9 – 22 January 2023 and 23 January – 5 February 2023).

era5_rainfall_anomalies
cmorph_bld_rainfall_anomalies
Figure 1: Rainfall anomalies for January 2023 based on GSMaP-NRT data (left) and CMORPH-Blended data (right). The climatological reference period is 2001-2022. Green colour denotes above-average rainfall (wetter), while orange denotes below-average rainfall (drier).


1.3 Warmer-than-average temperatures were recorded over northwestern Mainland Southeast Asia and parts of southeastern Maritime Continent, whereas cooler-than-average temperatures were observed over much of central and eastern Mainland Southeast Asia. Elsewhere in the ASEAN region, near-average temperatures were observed. The warmest anomalies were recorded over Myanmar and the coolest over the eastern Mainland Southeast Asia.

era5_temperature_anomalies


Figure 2: Temperature anomalies for January 2023 based on ERA-5 reanalysis. The climatological reference period is 2001-2022. Red colour denotes above-average temperature (warmer), while blue denotes below-average temperature (colder).


2. Climate Drivers

2.1 A Madden-Julian Oscillation (MJO) signal was present over the Western Pacific (Phases 6 & 7) at the start of January. This signal weakened in the first week of January, with no clear MJO signal present in based on the RMM diagram until the second half of the month. By the end of the third week of January, the MJO signal strengthened over the Indian Ocean (Phase 3). Typically, during this time of the year, Phase 7 tends to bring drier conditions to the western Maritime Continent, whereas Phase 3 tends to bring wetter conditions to the western Maritime Continent.

mjo_phase_diagram


Figure 3: The MJO phase diagram. The diagram illustrates the movement of the MJO through different phases, which correspond to different locations along the equator (denoted in the text with the first day of the month in blue and the last day of the month in red). The distance of the index from the centre of the diagram is related to the strength of the MJO. Values within the grey circle are considered weak or indiscernible (data from the Bureau of Meteorology, Australia).


2.2 La Niña conditions were present over the tropical Pacific. Sea surface temperatures in the Nino3.4 region (used to monitor ENSO) and the atmospheric indicators over the tropical Pacific Ocean were consistent with La Niña conditions, though there are signs of weakening. La Niña events tend to bring wetter-than-average conditions to much of the Maritime Continent during the December to February period.


January 12, 2023

Review of Regional Weather for December 2022

Review of Regional Weather for December 2022


1. Overview

1.1 During December 2022, a mix of below- to above-average rainfall was recorded over the Maritime Continent, while near-average rainfall was recorded over much of Mainland Southeast Asia, except for coastal parts of eastern Mainland Southeast Asia where above-average rainfall was recorded (Figure 1). The largest positive anomalies (wetter conditions) were recorded over northwestern Continent, including Malay Peninsula for both the GSMaP-NRT (Figure 1, left) and CMORPH-Blended (Figure 1, right) satellite-derived rainfall estimates. The largest negative anomalies (drier conditions) were recorded over the southern Borneo, with CMORPH-Blended data showing relatively drier anomalies as compared to GSMaP-NRT data.

1.2 The observed rainfall anomaly pattern of a mix of below- to above-average rainfall for the Maritime Continent and the above-average rainfall for eastern Mainland Southeast Asia are broadly consistent with the predictions from the subseasonal weather outlooks for December 2022 (28 November – 11 December 2022, 12 – 25 December 2022 and 26 December 2022 – 8 January 2023).

era5_rainfall_anomalies
cmorph_bld_rainfall_anomalies
Figure 1: Rainfall anomalies for December 2022 based on GSMaP-NRT data (left) and CMORPH-Blended data (right). The climatological reference period is 2001-2021. Green colour denotes above-average rainfall (wetter), while orange denotes below-average rainfall (drier).


1.3 Warmer-than-average temperatures were recorded over northwestern Mainland Southeast Asia and parts of southeastern Maritime Continent, whereas below- to near-average temperatures were observed elsewhere over the ASEAN region. The warmest anomalies were recorded over Myanmar and the coolest over the eastern Mainland Southeast Asia.

era5_temperature_anomalies


Figure 2: Temperature anomalies for December 2022 based on ERA-5 reanalysis. The climatological reference period is 2001-2021. Red colour denotes above-average temperature (warmer), while blue denotes below-average temperature (colder).


2. Climate Drivers

2.1 An Madden-Julian Oscillation (MJO) signal emerged over the Indian Ocean (Phase 3) and the Maritime Continent (Phase 4) at the end of the first week of December, based on the RMM index (Figure 3). This signal weakened and went inside the RMM unit circle at the end of the second week of December. At the end of the third week, an MJO signal reappeared over the Maritime Continent (Phases 4 & 5), which strengthened and propagated eastwards towards the Western Pacific (Phase 6) over the last week of December. Typically, during this time of the year, Phases 4 and 5 bring wetter conditions for most of the ASEAN region whereas Phase 6 tends to bring wetter conditions for eastern Maritime Continent. Therefore, the MJO may have contributed to the wetter conditions over northern parts of the Maritime Continent region December 2022.

mjo_phase_diagram


Figure 3: The MJO phase diagram. The diagram illustrates the movement of the MJO through different phases, which correspond to different locations along the equator (denoted in the text with the first day of the month in blue and the last day of the month in red). The distance of the index from the centre of the diagram is related to the strength of the MJO. Values within the grey circle are considered weak or indiscernible (data from the Bureau of Meteorology, Australia).


2.2 La Niña conditions were present over the tropical Pacific. Sea surface temperatures in the Nino3.4 region (used to monitor ENSO) and the atmospheric indicators over the tropical Pacific Ocean were consistent with La Niña conditions, though there are signs of weakening. La Niña events tend to bring wetter-than-average conditions to much of Southeast Asia during the September to November period.


December 15, 2022

Review of Regional Weather for November 2022

Review of Regional Weather for November 2022


1. Overview

1.1 During November 2022, a mix of below- to above-average rainfall was recorded over the Maritime Continent, while near-average rainfall was recorded over much of Mainland Southeast Asia, except for southern and northeastern Mainland Southeast Asia where a mix of below- to above-average rainfall was recorded (Figure 1). The largest positive anomalies (wetter conditions) were recorded over southern Mainland Southeast Asia and central Borneo, for the GSMaP-NRT (Figure 1, left) and CMORPH-Blended (Figure 1, right) satellite-derived rainfall estimates datasets respectively. The largest negative anomalies (drier conditions) were recorded over central Sumatra and northern half of the Philippines, with CMORPH-Blended data showing relatively drier anomalies as compared to GSMaP-NRT data.

1.2 The observed rainfall anomaly pattern of a mix of below- to above-average rainfall for the Maritime Continent and the above-average rainfall for southern Mainland Southeast Asia are broadly consistent with the predictions from the subseasonal weather outlooks for November 2022 (31 October – 13 November, 14 – 27 November and 28 November – 11 December), although the wetter condition over central Borneo was not included in any of the outlooks.

era5_rainfall_anomalies
cmorph_bld_rainfall_anomalies
Figure 1: Rainfall anomalies for November 2022 based on GSMaP-NRT data (left) and CMORPH-Blended data (right). The climatological reference period is 2001-2021. Green colour denotes above-average rainfall (wetter), while orange denotes below-average rainfall (drier).


1.3 Warmer-than-average temperatures were recorded over most of Southeast Asia north of 10°N, except for some northwesternmost parts of Mainland Southeast Asia where below- to near-average temperatures are observed. In contrast, below- to near-average temperatures were recorded for most of the regions south of 10°N during November 2022 (Figure 2), except for south-eastern parts of the Maritime Continent where above-average temperatures are observed. The warmest anomalies were recorded around northern Viet Nam, with the coolest anomalies over central parts of Java islands.

era5_temperature_anomalies


Figure 2: Temperature anomalies for November 2022 based on ERA-5 reanalysis. The climatological reference period is 2001-2021. Red colour denotes above-average temperature (warmer), while blue denotes below-average temperature (colder).


2. Climate Drivers

2.1 An Madden-Julian Oscillation (MJO) signal was present over the Western Pacific and the Western Hemisphere (Phases 7 and 8) in the first week of November, however it weakened and became indiscernible by the second week, based on the RMM Index (Figure 3). At the beginning of the third week, an MJO signal emerged over the Maritime Continent (Phase 4), which strengthened and propagated eastwards towards the Western Pacific (Phase 7), before becoming weak again at the end of the month. Typically, during this time of the year, Phase 6 tends to bring wetter conditions for eastern Maritime Continent while Phases 7 and 8 tends to bring drier conditions for the western Maritime Continent. Also for November, Phases 4 and 5 bring wetter conditions to much of the Southeast Asia. Therefore, the MJO may have contributed to the wetter conditions over southern coastal parts of Mainland Southeast Asia and southeastern Maritime Continent region in November 2022.

mjo_phase_diagram


Figure 3: The MJO phase diagram. The diagram illustrates the movement of the MJO through different phases, which correspond to different locations along the equator (denoted in the text with the first day of the month in blue and the last day of the month in red). The distance of the index from the centre of the diagram is related to the strength of the MJO. Values within the grey circle are considered weak or indiscernible (data from the Bureau of Meteorology, Australia).


2.2 La Niña conditions were present over the tropical Pacific. Sea surface temperatures in the Nino3.4 region (used to monitor ENSO) and the atmospheric indicators over the tropical Pacific Ocean were consistent with La Niña conditions. La Niña events tend to bring wetter-than-average conditions to much of Southeast Asia during the September to November period. Over the Indian Ocean, a negative Indian Ocean Dipole (IOD) was present and showing signs of weakening. Negative IOD tends to bring wetter-than-average conditions for much of Southeast Asia.