Review of Regional Weather for June 2020
1. Overview
1.1 During June 2020, the region between 5°S and 15°N predominately experienced above-average rainfall (Figure 1). The largest positive anomalies (wetter conditions) were recorded over northern Sulawesi, southern Thailand, southern Viet Nam, and western Borneo based on both satellite-derived rainfall estimates datasets (GSMaP-NRT and CMORPH-Blended). For the Mainland Southeast Asia, above-average rainfall inland conditions were observed over northern Myanmar and northern Laos, whereas below-average rainfall conditions were observed along coastal regions of western Myanmar and northern Viet Nam. Below-average rainfall was also recorded over northern parts of the Philippines and some parts of the eastern Maritime Continent (Java and Nusa Tenggara, Indonesia).
1.2 The observed large-scale rainfall anomaly patterns (i.e. above-average rainfall conditions in the equatorial regions and below-average conditions in northern parts of the Philippines and coastal parts of northern Viet Nam) are broadly consistent with the predictions in the subseasonal weather outlooks for the first and second fortnights of June 2020, except for some parts of the eastern Maritime Continent region where drier conditions were observed.


1.3 Most parts of equatorial Southeast Asia experienced near-average temperature during June 2020 (Figure 2), coinciding with areas that experienced wetter conditions during the same period. Warmer anomalies (≥ 0.5°C) are concentrated over Mainland Southeast Asia, northern parts of the Philippines and eastern Maritime Continent.

2. Climate Drivers
2.1 The Madden-Julian Oscillation (MJO) signal propagated eastwards from Phase 1 (Western Hemisphere) to Phase 2 (Indian Ocean) during the first two weeks of June. Typically for the region in June, Phases 1 and 2 bring drier conditions in northern Southeast Asia while Phase 2 brings wetter conditions in the western Maritime Continent. Subsequently the MJO then stalled, before weakening and becoming indiscernible by early part of the third week of June, obscured by other equatorial atmospheric waves. Towards the last few days of June, a new MJO signal re-emerged in Phase 1 (Western Hemisphere).

June 15, 2020
Review of Regional Weather for May 2020
Review of Regional Weather for May 2020
1. Overview
1.1 The rainfall anomalies for May 2020 can be partitioned broadly into northern and southern Southeast Asia (Figure 1). Over northern Southeast Asia (10-20°N), most of the coastal regions and some areas further inland experienced below-average rainfall. As this period marks the start of the Southwest Monsoon season, this could mean a slight delay in the onset of the monsoon season for some parts of northern Southeast Asia. There are differences in the intensity and spatial extent between the two data sources, GSMaP-NRT and CMORPH-Blended. For CMORPH-Blended, the areas with below-average rainfall extended further inland over Mainland Southeast Asia, apart from coastal Myanmar (wetter based on CMORPH-Blended, but drier based on GSMaP-NRT).
1.2 For southern Southeast Asia, most of the Maritime Continent region experienced above-average rainfall amounts. The more intense rainfall was observed over the western Maritime Continent (parts of Java, Sumatra, and Borneo). Over the eastern side (Maluku Islands and West Papua), mostly drier conditions were observed. This large-scale rainfall anomaly pattern (below-rainfall conditions in the north and above-average conditions in the south) is broadly consistent with the predictions in the subseasonal weather outlooks for the first and second fortnights of May 2020, except for the eastern Maritime Continent region.


1.3 Most parts of Southeast Asia experienced above-average temperature during May 2020 (Figure 2). Much warmer anomalies (≥ 1.0°C) are concentrated over Mainland Southeast Asia and West Papua; thus broadly aligned to areas that experienced drier conditions during the same period.

2. Climate Drivers
2.1 The Madden-Julian Oscillation (MJO) retreated from Phase 4 into the unit circle (weak signal) during the first and second weeks of May 2020. The MJO then emerged over the Indian Ocean (Phase 2) in the later part of the second week, weakened momentarily during Phase 3 and Phase 4, and re-emerged to propagate strongly eastwards in Phase 6, Phase 7, and Phase 8 in the last week of May 2020. Typically, the Maritime Continent experiences drier conditions during Phase 6 to Phase 8 of the MJO. For May 2020, this is only true for the eastern Maritime Continent (see 1.2). The western Maritime Continent rainfall anomaly, on the other hand, could have been dominated by the wetter conditions that prevailed in the first three weeks.

May 13, 2020
Review of Regional Weather for April 2020
Review of Regional Weather for April 2020
1. Overview
1.1 The rainfall anomalies for April 2020 were a mix of above-, near-, and below- average (Figure 1). Above-average rainfall was experienced by much of the western and southern parts of the Maritime Continent (Peninsular Malaysia, Sumatra, Java, and western parts of Borneo) as well as parts of Mainland Southeast Asia (northern Lao PDR, northern Viet Nam, southern Cambodia, and southern Thailand). The largest positive anomalies (wetter conditions) were recorded over Sumatra based on both satellite-derived rainfall estimates datasets (GSMaP-NRT and CMORPH-Blended), as well as over Java (CMORPH-Blended only). Below-average rainfall was recorded over central and southern Philippines, as well as northern Borneo. The rest of the regions either experienced near-average rainfall for this time of year, or a mix between above- and below-average. The observed large-scale rainfall anomaly pattern over the Southeast Asia region during April (i.e. wetter over the southern parts of the Maritime Continent, and drier over central and southern Philippines, as well as northern Borneo) is broadly aligned with the model predictions depicted in the subseasonal weather outlooks for the first and second fortnights of April 2020, apart from the anomalies over Mainland Southeast Asia.


1.2 Most parts of Southeast Asia south of 10°N experienced above-average temperature during April 2020 (Figure 2). The region between 10°N and 20°N experiences a range of below-average to above-average temperatures, while the northernmost parts of Southeast Asia (northern Myanmar, northern Lao PDR, and northern Viet Nam) experienced below-average temperature.

2. Climate Drivers
2.1 The Madden-Julian Oscillation (MJO) was active during April 2020. The MJO signal propagated eastwards from Phase 4 (Maritime Continent) to Phase 1 (Western Hemisphere) during the first two weeks of April. The MJO then stalled during the third week, before continuing to propagate eastward through Phases 2 and 3 (Indian Ocean) before reaching Phase 4 (Maritime Continent) at the end of the month. Typically for the region in April, Phases 7, 8, and 1 bring drier conditions, while Phases 3 to 5 bring wetter conditions, particularly in southern Southeast Asia.

April 15, 2020
Review of Regional Weather for March 2020
Review of Regional Weather for March 2020
1. Overview
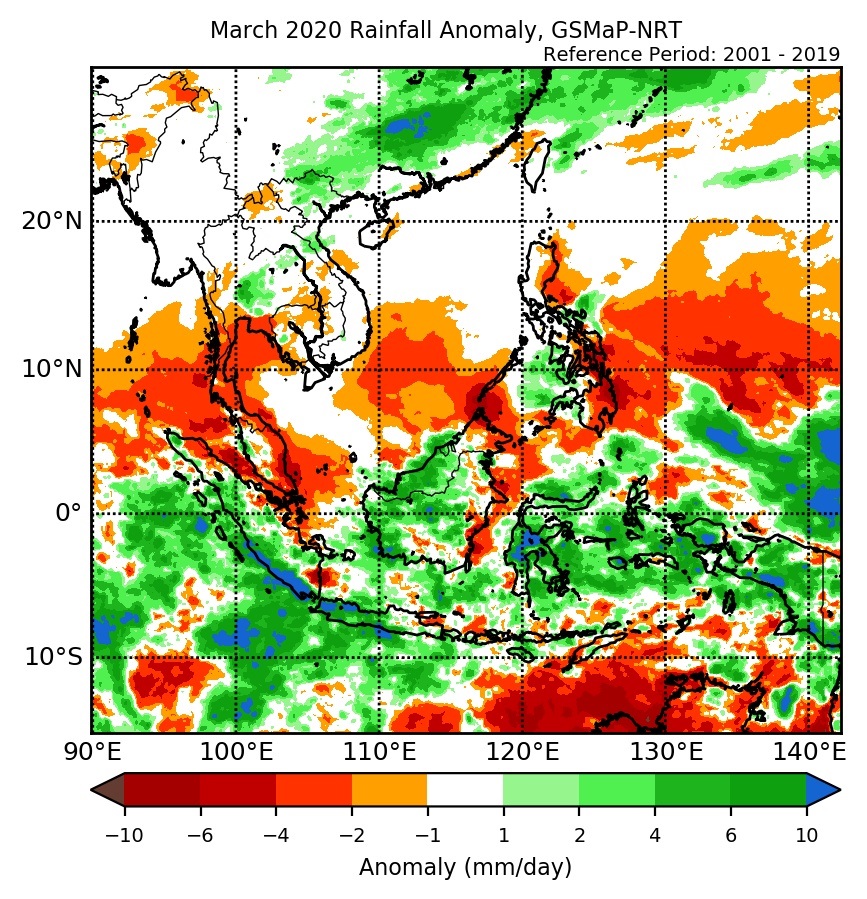
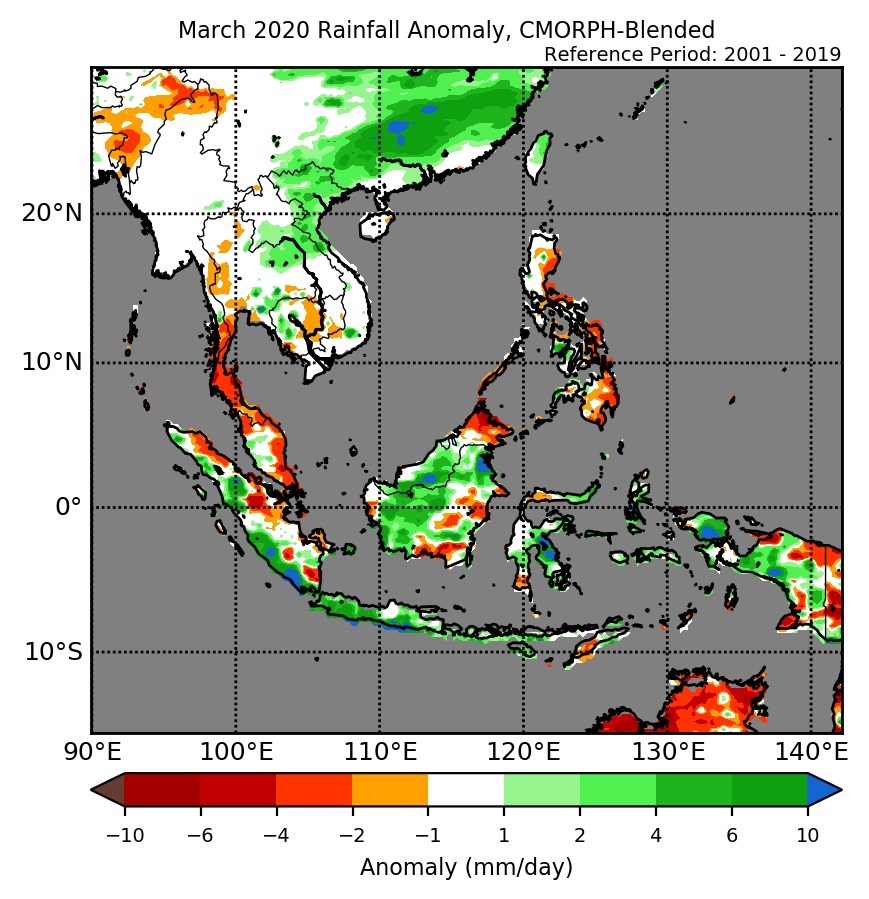
1.1 Much of the region south of the equator experienced above-normal rainfall during March 2020 (Figure 1). In particular, parts of southern Sumatra, West Papua, and central Sulawesi experienced more intense wetter conditions based on both satellite-derived rainfall estimates datasets (GSMaP-NRT and CMORPH-Blended). For north of the equator, below-average rainfall is experienced in most places (between 0°-15°N) over the sea, over the eastern coasts of land masses (Peninsular Malaysia, Borneo, and the Philippines) and southern Thailand. The observed large-scale rainfall anomaly patterns over the Southeast Asia region during March (i.e. wetter to the south, and drier to the north of the equator) are broadly aligned with the model predictions depicted in the subseasonal weather outlooks for the first and second fortnights of March 2020.
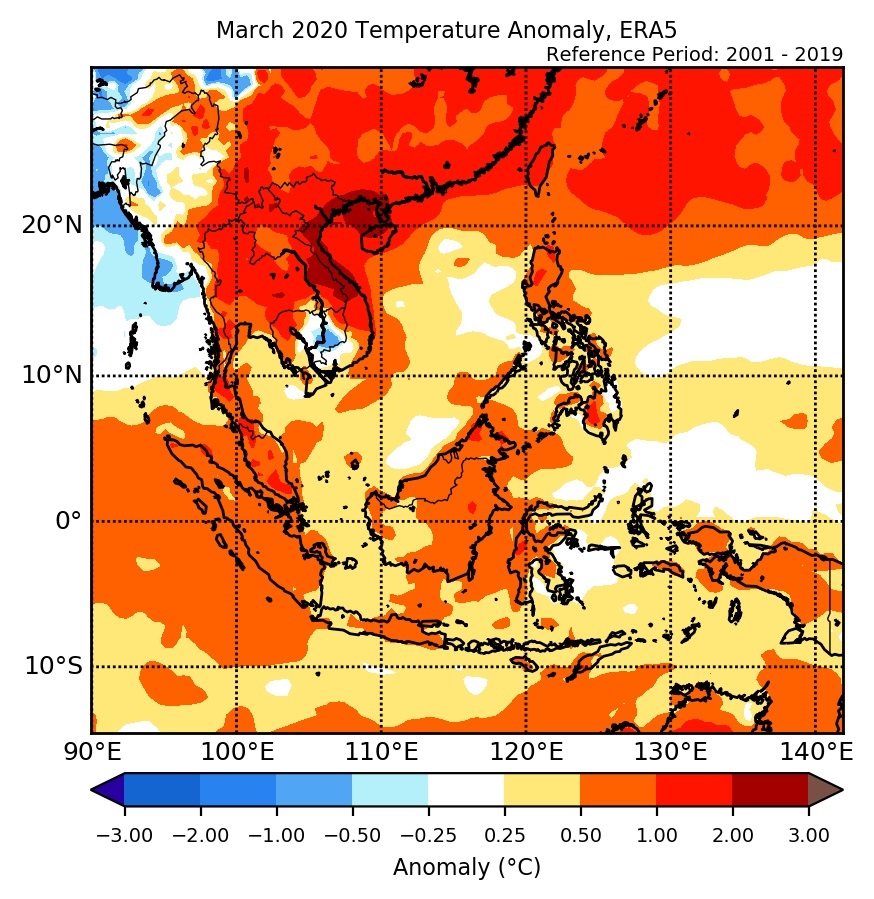
1.2 Most parts of Southeast Asia experienced above-average temperature during March 2020 (Figure 2). The largest warm anomalies occurred over parts of northern and central Viet Nam. Apart from the far eastern, southern, and northern corners, the rest of Myanmar experienced near-normal to below-normal temperature conditions during March 2020.
2. Climate Drivers
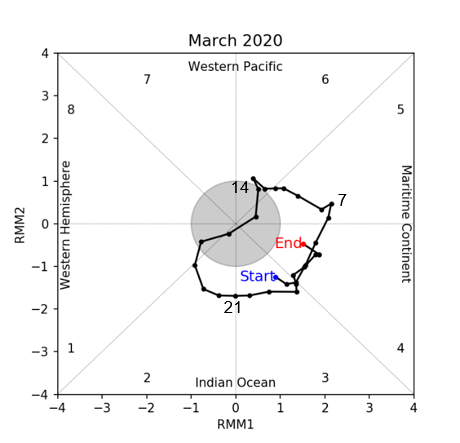
2.1 The Madden-Julian Oscillation (MJO) was active for much of March 2020. The MJO signal propagated eastwards from Phase 3 (Indian Ocean) to Phase 5 (Maritime Continent) during the first two weeks of March. The MJO then re-emerged in the third week in Phase 2 (Indian Ocean) and continued propagating until the end of March in Phase 4 (Maritime Continent). Generally, the phases the MJO went through (Phases 2-5) in March typically bring wetter conditions to many parts of the Maritime Continent, especially the south.
March 18, 2020
Review of Regional Weather for February 2020
Review of Regional Weather for February 2020
1. Overview
1.1 During February 2020, the region south of the equator predominately experienced above-average rainfall (Figure 1), with the largest positive anomalies (wetter conditions) over Java Island, Indonesia and southern Borneo. For north of the equator, above-average rainfall was observed over some coastal regions of Peninsular Malaysia while northern Borneo and most of the Philippines experienced below-average rainfall. The rainfall anomalies over mainland Southeast Asia were negligible, which is expected given that February is the drier time of the year for that region.


1.2 Overall, most of Southeast Asia experienced above-average temperature during February 2020 (Figure 2). The largest anomalies occurred over parts of Sulawesi, Papua and northern Viet Nam. As for the northern Southeast Asia, some parts of Cambodia, Thailand and Myanmar experienced below-average temperatures.

2. Climate Drivers
2.1 A Madden–Julian Oscillation (MJO) signal developed and strengthened over the Maritime Continent (Phases 4 and 5) during the first two weeks of February 2020 (Figure 3). The signal propagated eastwards with the main precipitation envelope reaching the western tip of Western Pacific (Phase 6). By the end of the second week, however, this MJO signal stalled, before weakening and becoming indiscernible in the third week of February. Broadly, Phases 4 and 5 normally bring wetter conditions for much of Southeast Asia in February, while Phase 6 brings a mixture of wetter and drier conditions.

2.2 The strong positive Indian Ocean Dipole (IOD) event from 2019, which had been weakening since November 2019, continued to weaken and returned to the neutral state in January 2020. The IOD typically remains in the neutral phase during the season from January to April.
February 25, 2020
Review of Regional Weather for January 2020
Review of Regional Weather for January 2020
1. Overview
1.1 During January 2020, the region between 0° and 10°N predominately experienced below-average rainfall (Figure 1). For south of the equator, there was a mixture of below- and above-average rainfall, with the largest positive anomalies (wetter conditions) over southern Borneo. The rainfall anomalies over mainland Southeast Asia were small, which is expected given that January is the drier time of the year for that region.


1.2 Overall, most of Southeast Asia experienced above-average temperature during January 2020 (Figure 2). The largest anomalies occurred over northern Thailand, Laos and Viet Nam. Only western and northern Myanmar, and some parts of Cambodia, experienced near-average temperatures.

2. Climate Drivers
2.1 A Madden–Julian Oscillation (MJO) signal developed over the Maritime Continent (Phase 4) during the first week of January 2020 (Figure 3). The signal strengthened rapidly, and then propagated eastwards with the main precipitation envelope reaching the Western Pacific (Phase 7). By the end of January, however, this MJO signal had weakened and became indiscernible. Phase 4 normally brings wetter conditions for much of Southeast Asia, while Phase 7 is associated with drier conditions. Phases 5 and 6 bring a mixture of wetter and drier conditions.

2.2 The strong positive Indian Ocean Dipole (IOD) event from 2019, which had been weakening since November 2019, continued to weaken and returned to the neutral state in January 2020. The IOD typically remains in the neutral phase during the season from January to April.
January 7, 2020
Review of Regional Weather Conditions for Second Fortnight of December 2019
Review of Regional Weather Conditions for Second Fortnight of December 2019
1. Review of Regional Weather Conditions for Second Fortnight of December 2019
1.1 Northeast Monsoon conditions over the ASEAN region persisted into the second fortnight of December 2019. During the preview period, the prevailing winds blew from the northeast or east over the northern ASEAN region and from the northwest or northeast over most parts of equatorial ASEAN region.


1.2 Showers fell over many areas in the southern ASEAN region. East Malaysia, southern Sumatra, Kalimantan and Java recorded above-average rainfall while rainfall was below average in Peninsular Malaysia, and northern and central Sumatra. Parts of the Philippines received above-average rainfall due to the passage of Tropical Storm PHANFONE across central Philippines in late December 2019. Over the Mekong sub-region, dry weather persisted in the second fortnight of December 2019.


1.3 Despite the strong Madden–Julian Oscillation (MJO) signal in Phases 6 and 7 in the last week of December 2019, its contribution to the rainfall in the eastern Maritime Continent was not discernible and could have been masked by the presence of Tropical Storm PHANFONE.

1.4 The El-Niño Southern Oscillation (ENSO) remains neutral (i.e neither El Niño nor La Niña conditions). The Indian Ocean Dipole (IOD) is currently slightly positive but continues to weaken and a return to neutral state by early 2020 is likely.
December 23, 2019
Review of Regional Weather Conditions for First Fortnight of December 2019
Review of Regional Weather Conditions for First Fortnight of December 2019
1. Review of Regional Weather Conditions for First Fortnight of December 2019
1.1 Northeast Monsoon conditions prevailed over the region in the first half of December 2019. A monsoon surge brought strong northeasterly winds over the South China Sea and rainy weather to the equatorial ASEAN region. Parts of Malaysia, Singapore, Sumatra and Kalimantan recorded above-average rainfall. Tropical Storm ‘Kammuri’ made landfall over the Philippines in early December and contributed to the above-average rainfall recorded there. In contrast, dry weather prevailed over the Mekong sub-region.


1.2 The Madden – Julian Oscillation’s (MJO) signal was indiscernible for much of the fortnight, and was weak in Phases 2 and 3 over the last few days of the fortnight. Its contributions to the wetter conditions over the region during this period was therefore limited.
1.3 The El Niño – Southern Oscillation (ENSO) remained in its neutral state, while the positive Indian Ocean Dipole (IOD) continued to weaken over the fortnight.
December 12, 2019
Review of Regional Weather Conditions for Second Fortnight of November 2019
Review of Regional Weather Conditions for Second Fortnight of November 2019
1. Review of Regional Weather Conditions for Second Fortnight of November 2019
1.1 Northeast Monsoon conditions began to set in over the northern ASEAN region in mid November. Persistent north-easterly winds prevailed over the northern ASEAN region and the South China Sea. Winds to the south of the equator were light and blew mainly from the southeast.


Figure 1: 5000 ft average winds (left) and winds anomaly (right) for 16 – 30 November 2019. (Source: JMA)
1.2 Most of the rainfall fell over the equatorial region, including Brunei, Malaysia, Singapore, Sumatra and Kalimantan. Typhoon Kalmaegi, which developed over the sea areas east of the Philippines, brought heavy showers to the northern parts of Luzon between 18 – 20 November 2019. Dry weather prevailed over most parts of the Mekong sub-region during the review period.

Figure 2: Historical track of Typhoon Kalmaegi. (Source: JAXA)
1.3 Because of the dry weather in the northern ASEAN region, many parts of the Mekong sub-region experienced below-average rainfall during the review period. In the southern ASEAN region, rainfall was near-average to above-average over the equatorial region. Rainfall was below-average over the eastern archipelago of Indonesia.


1.4 In the second half of November 2019, the Madden-Julian Oscillation (MJO) began to weaken but continued to propagate through Phase 8 – 1 into the Indian Ocean. The MJO although weak, could have contributed to the easterly wind anomalies observed over the Indian Ocean and Java Sea.

Figure 5: The MJO phase diagram for November 2019 (blue). The diagram illustrates the movement of the MJO through different phases, which correspond to different locations along the equator. The distance of the index from the centre of the diagram is correlated with the strength of MJO. When the index falls within the circle, the MJO is considered weak or indiscernible. (Source: Bureau of Meteorology)
1.5 The El-Niño Southern Oscillation (ENSO) continued to remain in the neutral state (i.e neither El Niño nor La Niña conditions). The Indian Ocean Dipole (IOD) remained in the positive phase, but was declining.
November 27, 2019
Review of Regional Weather Conditions for First Fortnight of November 2019
Review of Regional Weather Conditions for First Fortnight of November 2019
1. Review of Regional Weather Conditions for First Fortnight of November 2019
1.1 In the first fortnight of November 2019, northeasterly winds prevailed over many parts of the northern ASEAN region (Figure 1). Under the influence of Tropical Stroms Matmo and Nakri (Figure 2), there were anomalously strong westerly winds to the east of Viet Nam and west of the Philippines. Over the equatorial region, winds were weak and variable in direction. In parts of the southern ASEAN region south of the equator, the prevailing winds blew mainly from the southeast.


Figure 1: 5000 ft average winds (left) and anomalies (right) for 1 – 15 Nov 2019. (Source: JMA)


Figure 2: Historical track of Tropical Storm Matmo (left) and Tropical Storm Nakri (right). (Source: JAXA)
1.2 In the northern ASEAN region, the occurrence of the tropical storms resulted in above-average rainfall over the Philippines and Viet Nam, while drier conditions prevailed over many parts in the Mekong sub-region. In the southern ASEAN region, the monsoon rain band over the equatorial areas brought above-average rainfall over Sumatra, western Java, Malaysia, and most parts of Kalimantan. Figures 3 and 4 shows the daily average rainfall and the percentage of average rainfall respectively for the second fortnight of November 2019.


1.3 The Madden-Julian Oscillation (MJO) strengthened and propagated from Phase 5 to Phase 8 in the first fortnight of November 2019. However, its effect in moderating the rainfall over the southern ASEAN region was offset by the development of low-pressure systems over the South China Sea during the period.

Figure 5: The MJO phase diagram for November 2019 (blue). The diagram illustrates the movement of the MJO through different phases, which correspond to different locations along the equator. The distance of the index from the centre of the diagram is correlated with the strength of MJO. When the index falls within the circle, the MJO is considered weak or indiscernible. (Source: Bureau of Meteorology)
1.4 The El Niño – Southern Oscillation (ENSO) remained in the neutral state in the first half of November 2019, and the sea-surface temperatures (SST) over the tropical Pacific Ocean continued to cool. Over the Indian Ocean, the positive phase of the Indian Ocean Dipole (IOD) persisted.