Category Archives: Fortnightly Weather Review

CR58

October 12, 2017

Review of Regional Weather and Smoke Haze for Sep 2017

Review of Regional Weather and Smoke Haze for Sep 2017

Print Version

1.   Review of Regional Weather Conditions in September 2017

1.1    In September 2017, Southwest Monsoon conditions prevailed over the ASEAN region, and the monsoon rain band migrated further south with most of the shower activities occurring over the equatorial region between 5oS and 15oN. The rainfall distribution for September 2017 is shown in Figure 1.

figure1

Figure 2: Daily Average Rainfall for September 2017. The rainfall data may be less representative for areas with a less dense rainfall network.

figure2

Figure 2: Percent of Normal Rainfall for September 2017. The rainfall data may be less representative for areas with a less dense rainfall network.

1.2    During the month, rainfall was below-normal over northern and central Thailand, while normal to above-normal rainfall prevailed for other parts of the northern ASEAN region. In contrast, for the southern ASEAN region, rainfall was mostly above-normal, particularly over Malaysia, Sumatra, Sulawesi and Papua. Figure 2 shows the percentage normal of rainfall for September 2017.

1.3    In September 2017, there were several tropical cyclones that brought heavy rainfall to Asia Pacific region. Among these tropical cyclones, only typhoon ‘Doksuri’ brought heavy rainfall and strong winds to the Philippines and Vietnam. “Doksuri” developed on 10 September 2017, and made landfall over Luzon, the Philippines before moving westwards over northern Philippines and into the South China Sea. ’Doksuri’ intensified into a typhoon as it continued to track west-northwestward over the South China Sea towards Vietnam. On 15 September 2017, Typhoon Doksuri made landfall near the north central regions of Vietnam. In addition to the torrential rain and strong winds, the coastal provinces of Vietnam experienced storm surges which accompanied the typhoon, Typhoon Doksuri weakened and dissipated shortly after making landfall.

figureNa

Figure 3: Historical storm tracks for Typhoon Doksuri. (Source: JAXA)


1.4    The prevailing winds during September 2017 were predominantly from the southeast or southwest, particularly over the southern ASEAN region. In the northern ASEAN region, winds were light and blew from the south or southwest. Broad easterly wind anomalies were observed over the western Pacific Ocean and parts of the South China Sea. Figure 4 shows the average and anomalous winds at 5000 feet.

figure3a

figure3b

Figure 4: 5000 ft average winds (left) and anomaly (right) for September 2017.

1.5    In September 2017, the equatorial Pacific Ocean’s sea-surface temperature (SST) over the Nino 3.4 region remained at neutral (neither El Niño nor La Niña) values. However, in recent weeks, there has been a gradual cooling of the sea surface temperatures, and the Nino 3.4 index dipped to negative values. However, atmospheric conditions, such as trade winds and cloudiness, over the equatorial Pacific have largely remained neutral.

1.6    The Madden Julian Oscillation (MJO) was weak and non-discernible in September 2017. Although there was a faint and brief MJO signal in Phase 3 in mid-September 2017, overall, the MJO did not have a significant influence on the weather conditions over the southern ASEAN region.during the month.

figure4

Figure 5: The MJO phase diagram for September 2017. The MJO phase diagram illustrates the movement of the MJO through different phases, which correspond to different locations along the equator. The distance of the index from the centre of the diagram is correlated with the strength of MJO. When the index falls within the circle, the MJO is considered weak or no signal exhibited. (Source: Bureau of Meteorology)

2.   Review of Land/Forest Fires and Smoke Haze Situation

2.1     Hotspot activities in the northern ASEAN region were generally subdued in September 2017 due to wet weather conditions. In the southern ASEAN region, there were isolated or scattered hotspots detected mainly in southern Sumatra and West Kalimantan but the region was relatively wetter than usual during the month.

2.2    On a few days in the third week of September 2017, Kalimantan experienced a brief period of dry weather conditions. This led to an increase of hotspot activities in West Kalimantan on 22 and 23 September 2017, and localised smoke haze and plumes were seen emanating from some of the hotspots. The hotspots were short-lived as showers on subsequent days helped to bring an improvement to the hazy conditions. Satellite images depicting some of the hotspot activities over parts of the ASEAN region during September 2017 are shown in Figure 6 – Figure 10.

figure5

Fig. 6: NOAA-19 satellite image on 12 September 2017 shows isolated hotspots detected in southern Sumatra.

figure6

Fig. 7: NOAA-19 satellite image on 13 September 2017 shows hotspot activities in Kalimantan subdued by wet weather conditions.


figure7

Figure 8: NOAA-19 satellite image on 14 September 2017 shows Typhoon Doksuri approaching Vietnam.

figure8

Figure 9: NOAA-19 satellite image on 22 September 2017 shows scattered hotspots with slight to moderate smoke haze observed in West Kalimantan.

figure9

Figure 10: NOAA-19 satellite image on 29 September 2017 shows increased shower activities over the southern ASEAN region, particularly in Kalimantan and Java.

2.3    The hotspot distribution charts and daily hotspot charts for September 2017 are shown in Figure 11, Figure 12 and Figure 13 respectively.

figure10

Figure 11: Figure 10: NOAA-19 hotspots distribution in September 2017.

figure11

FigFigure 12: Hotspot Counts in Cambodia, Lao PDR, Thailand, Vietnam and Myanmar in September 2017.

figure12

Figure 13: Hotspot Counts in Sumatra, Borneo and Peninsular Malaysia in September 2017.

3.   Status of El Niño/La Niña and Indian Ocean Dipole

3.1    International climate centres have projected that the sea surface temperature would continue to cool in the second half of 2017. During this period, latest experts’ consensus favour neutral conditions or weak La Niña conditions.

3.2    Typically, El Niño brings drier-than-normal rainfall conditions to most parts of Southeast Asia during the Southwest Monsoon season. During La Niña events, the opposite, i.e. wetter-than-normal condition, normally occurs. Locally specific impact differs from place to place and for different seasons

3.2    In September 2017, the Indian Ocean Dipole (IOD) index remained in the neutral state (Figure 14). In the next few months, international climate models forecast the IOD to remain neutral.

figure13

Figure 14: Indian Ocean Dipole (IOD) index time series. The IOD index is at the neutral level for September 2017.

September 19, 2017

Review of Regional Weather and Smoke Haze for Aug 2017

Review of Regional Weather and Smoke Haze for Aug 2017

Print Version

1.   Review of Regional Weather Conditions in August 2017

1.1    Southwest Monsoon conditions continued to prevail in the region in August 2017. The monsoon rain band was located in the Northern Hemisphere, between latitude 5oN and 20oN, and brought extensive rainfall over the region. Heavy rain fell over the coastal regions of Myanmar and the northern parts of the Philippines. For the southern ASEAN region, dry weather conditions were experienced over parts of southern Sumatra and Java. The rainfall distribution for August 2017 is shown in Figure 1.

figure1

Figure 1: Daily average rainfall for the ASEAN region in August 2017. (Source: JAXA Global Satellite Mapping of Precipitation)

figure2

Figure 2: Percent of Normal Rainfall for August 2017. The rainfall data may be less representative for areas with low density of rainfall network.


1.2    In August 2017, rainfall was near-normal to above-normal over the northern ASEAN region except in Cambodia where rainfall was below-normal. In the southern ASEAN region, near-normal to above-normal rainfall prevailed except in southern Sumatra and parts of Java where rainfall was below-normal. Figure 2 shows the percent normal of rainfall for August 2017.

1.3    Two tropical storms – Hato and Pakhar were brewing in August 2017 over the western Pacific Ocean. Tropical Storm Hato developed to the northeast of the Philippines on the 20 August 2017. It tracked westwards and made landfall over the coast of southern China on the 23 August 2017. Tropical Storm Pakhar developed over the sea areas to the east of Luzon, the Philippines, on the 25 August 2017, and tracked north-westwards, crossing over northern Philippines before making landfall over the coast of southern China on the 27 August 2017. Both tropical storms brought heavy rains to Hong Kong and widespread shower activities over the northern ASEAN region.

figureNa

figureNb

Figure 3: Historical storm tracks for Tropical Storm Hato (left) and Tropical Storm Pakhar (right). (Source: JAXA)


1.4    The prevailing winds in August 2017 were predominantly from the southwest in the northern ASEAN region, and from the southeast in the southern ASEAN region. Figure 3 shows the average and anomalous winds at 5000 feet. In the month of August 2017, anomalous northeasterly to easterly winds dominated over the South China Sea and the region east of the Philippines. Furthermore, an anomalous cyclonic circulation was observed over the South China Sea, east of Hainan Island, associated with the tropical storms Hato and Pakhar.

figure3a

figure3b

Figure 4: 5000 ft average winds (left) and anomaly (right) for August 2017.


1.5    In August 2017, the equatorial Pacific Ocean’s sea-surface temperature (SST) over the Nino3.4 region was close to the El Niño Nino 3.4 index threshold. Most of the atmospheric indicators such as wind and cloudiness were fluctuating about the neutral values.

1.6    During the month, the Madden Julian Oscillation (MJO)1 was generally weak and non-discernible except for a brief period in Phase 2 towards the end of August 2017. Overall, the contribution by the MJO on the weather over the Maritime continent in August 2017 was not significant.

figure4

Figure 5: The MJO phase diagram for August 2017 (green). The MJO phase diagram illustrates the movement of the MJO through different phases, which correspond to different locations along the equator. The distance of the index from the centre of the diagram is correlated with the strength of MJO. When the index falls within the circle, the MJO is considered weak or indiscernible. (Source: Bureau of Meteorology)


2.   Review of Land/Forest Fires and Smoke Haze Situation

2.1     In the first half of August 2017, the dry weather conditions led to an increase in hotspot activities in both the northern and southern ASEAN regions. On the 4 August 2017 and 6 August 2017, there were significant hotspot activities detected over Borneo and Sumatra respectively but no smoke haze was observed.

2.2    In the second half of August 2017, tropical storms Hato and Pakhar brought widespread showers to the region and subdued the hotspot activities in the northern ASEAN region. In contrast, some brief episodes of dry weather conditions over the southern ASEAN region led to an increase in hotspot activities, mostly in southern Sumatra and Borneo. Satellite images depicting some of the hotspot activities over parts of the ASEAN region in August 2017 are shown in Figures 6 – 9.

figure6

Figure 6: NOAA-19 satellite image on 6 Aug 2017 shows hotspot activities over Sumatra.

figure5

Figure 7: NOAA-19 satellite image on 4 Aug 2017 shows hotspot activities over West Kalimantan.


figure7

Figure 8: NOAA-19 satellite image on 27 Aug 2017. Tropical Storm Pakhar made landfall over southern China, inducing scattered showers over the Indochina.

figure8

Figure 9: NOAA-19 satellite image on 27 Aug 2017 show hotspots over southern and western Kalimantan.

2.3    The hotspot distribution and daily hotspot charts for August 2017 are shown in Figure 10 and Figure 11 and 12 respectively.

figure10

Figure 10: NOAA-19 hotspots distribution in August 2017.

figure11

Figure 11: Hotspot Counts in Cambodia, Lao PDR, Thailand, Vietnam and Myanmar in August 2017.

figure12

Figure 12: Hotspot Counts in Sumatra, Borneo and Peninsular Malaysia in August 2017.


3.   Outlook of El Niño/La Niña and Indian Ocean Dipole

3.1    Climate models from major climate centres indicate that the neutral (neither El Nino nor La Nina, conditions are expected to persist for the rest of 2017.

3.2    Typically, El Niño brings drier-than-normal rainfall conditions to most parts of Southeast Asia during the Southwest Monsoon season. During La Niña events, the opposite, i.e. wetter-than-normal condition, normally occurs. Locally specific impact differs from place to place and for different seasons.

3.3    In the southern ASEAN region, occasional periods of drier weather can still be expected, and could lead to an occurrence of transboundary haze in the region. Hence, vigilance should be maintained for any escalation in hotspot activities in the fire-prone areas in the coming months.

3.4    In August 2017, the Indian Ocean Dipole (IOD) index was neutral (Figure 13). In the next few months, climate models from major climate centres project the IOD to remain neutral, with the possibility that a positive IOD may develop towards the end of 2017.

figure13

Figure 13: Indian Ocean Dipole (IOD) index time series. The IOD index was at neutral levels in August 2017. (Source: Bureau of Meteorology, Australia)

August 18, 2017

Review of Regional Weather and Smoke Haze for Jul 2017

Review of Regional Weather and Smoke Haze for Jul 2017

Print Version

1.   Review of Regional Weather Conditions in July 2017

1.1    Southwest Monsoon conditions continued to prevail in the region in July 2017. The monsoon rain band shifted further north and brought extensive rainfall over the region between latitudes 5oN and 20oN. Heavy rain fell over the coastal regions of Myanmar, Vietnam, the northern South China Sea and the northern parts of Philippines. For the southern ASEAN region, particularly over parts of Sumatra and Java, experienced dry weather conditions in the second half of the month. The rainfall distribution for July 2017 is shown in Figure 1.

figure1

Figure 1: Daily average rainfall for the ASEAN region in July 2017. (Source: JAXA Global Satellite Mapping of Precipitation).

figure2

Figure 2: Percentage of Normal Rainfall for July 2017. The rainfall data July be less representative for areas with low density of rainfall network.

1.2    In July 2017, rainfall was above normal over the northern ASEAN region. In the southern ASEAN region, near-normal to above-normal rainfall prevailed except in northern Sumatra, Sarawak, northern Kalimantan and parts of Java where rainfall was below-normal. Figure 2 shows the percentage normal of rainfall for July 2017.

1.3    Two tropical storms – Talas and Sonca formed over the South China Sea, east of Vietnam between 15 – 16 July 2017 and 21 – 25 July 2017 respectively. Tropical Storm Talas brought heavy rain and strong winds over the northern parts of Vietnam as it tracked westward on 16 July 2017. The storm dissipated the next day as it made landfall in northern Vietnam. Tropical Storm Sonca tracked westwards, similar to that of Talas except that Sanca’s impact was more widespread and brought heavy thunderstorms to parts of Thailand, Lao PDR and Vietnam.

figureNa

figureNb

Figure 3: Historical storm tracks for Tropical Storm Talas (left) and Tropical Storm Sonca (right). (Source: JAXA)


1.4    The prevailing winds during July 2017 were predominantly from the southwest in the northern ASEAN region, and from the southeast or southwest in the southern ASEAN region. An anomalous cyclonic circulation associated with Tropical Storms Talas and Sonca was present over the South China Sea. Figure 4 shows the average and anomalous winds at 5000 feet.

figure3a

figure3b

Figure 4: 5000 ft average winds (left) and anomaly (right) for July 2017.

1.5    In July 2017, the equatorial Pacific Ocean’s sea-surface temperature (SST) over the Nino3.4 region was warmer than average and close to the El Niño Nino 3.4 index threshold. However, these SST patterns over the tropical Pacific Ocean did not indicate developing El Niño conditions, and the atmospheric indicators such as cloudiness and winds over the equatorial Pacific were at neutral El Niño Southern Oscillation (ENSO) levels.

1.6    During the month, the Madden Julian Oscillation (MJO) was largely weak and non-discernible except for a few days around mid-July 2017 where the MJO strengthened as it emerged in Phase 3 bringing an increase in rainfall over the western Maritime continent. Overall, the contribution by the MJO on the weather over the Maritime continent in July 2017 was not significant.

figure4

Figure 5: The MJO phase diagram for July 2017. The MJO phase diagram illustrates the movement of the MJO through different phases, which correspond to different locations along the equator. The distance of the index from the centre of the diagram is correlated with the strength of MJO. When the index falls within the circle, the MJO is considered weak or no signal exhibited. (Source: Bureau of Meteorology)

2.   Review of Land/Forest Fires and Smoke Haze Situation

2.1     In the first half of July 2017, hotspot activities in both the northern and southern ASEAN regions remained subdued due to wet weather conditions.

2.2    In the second half of July 2017, dry weather conditions set in over parts of Sumatra and Kalimantan. Significant hotspot activities were first observed in West Aceh Regency, Sumatra, and between 23 and 26 July 2017, hazy conditions were reported with visibility reduced to a low of 2-3 km during the period. With the occurrence of showers in the days following, 26 July 2017, the haze situation in West Aceh Regency improved. However, in the central and southern parts of Sumatra, the dry weather conditions in the last week of the month brought an increase in hotspot activities which persisted until the end of July 2017. Satellite images depicting some of the hotspot activities over parts of the ASEAN region during July 2017 are shown in Figure 6 – Figure 10.

figure5

Fig. 6: NOAA-19 satellite image on 5 July 2017 shows shower activities over Kalimantan.

figure6

Fig. 7: NOAA-19 satellite image on 16 July 2017 shows Tropical Storm Talas located off the coast of Vietnam with extensive rain bands extending over northern Vietnam.


figure7

Figure 8: NOAA-19 satellite image on 26 July 2017 shows localised smoke plumes emanating from hotspots detected in West Aceh, Sumatra.

figure8

Figure 9: NOAA-19 satellite image on 30 July 2017 shows hotspots over central and southern Sumatra following an extended period of dry weather conditions.

figure9

Figure 10: NOAA-19 satellite image on 31 July 2017 shows localised smoke haze observed near hotspots detected in West Kalimantan.

2.3    The hotspot distribution charts and daily hotspot charts for July 2017 are shown in Figure 11, Figure 12 and Figure 13 respectively.

figure10

Figure 11: Figure 10: NOAA-19 hotspots distribution in July 2017.

figure11

Figure 12: Hotspot Counts in Cambodia, Lao PDR, Thailand, Vietnam and Myanmar in July 2017.

figure12

Figure 13: Hotspot Counts in Sumatra, Borneo and Peninsular Malaysia in July 2017.


3.   Status of El Niño/La Niña and Indian Ocean Dipole

3.1    International climate centres have forecast that the observed warming of the tropical Pacific Ocean would subside and that neutral ENSO conditions are expected to prevail in the second half of 2017.

3.2    Typically, El Niño brings drier-than-normal rainfall conditions to most parts of Southeast Asia during the Southwest Monsoon season. During La Niña events, the opposite, i.e. wetter-than-normal condition, normally occurs. Locally specific impact differs from place to place and for different seasons.

3.3    Despite the low likelihood of an El Niño developing, periods of dry weather condition can still be expected and could lead to the occurrence of transboundary haze in the region. Hence, vigilance should be maintained for any escalation in hotspot activities in the fire-prone areas in the coming months.

3.3    In July 2017, the Indian Ocean Dipole (IOD) index remained in the neutral state (Figure 14). In the next few months, international climate models forecast the IOD to remain neutral, with the possibility that a positive IOD may develop towards the end of the year.

figure13

Figure 14: Indian Ocean Dipole (IOD) index time series. The IOD index was at neutral levels in July 2017.

July 12, 2017

Review of Regional Weather and Smoke Haze for Jun 2017

Review of Regional Weather and Smoke Haze for Jun 2017

Print Version

1.   Review of Regional Weather Conditions in Jun 2017

1.1    Southwest Monsoon conditions became established over the ASEAN region in June 2017. The intensification of the sub-tropical high pressure system in the southern hemisphere gave rise to persistent southeasterly winds south of the equator and southwesterly winds north of the equator. During this period, the monsoon rain band was located between 5 S and 20 N. Heavy rainfall fell along the coastal areas of Myanmar as well as in the eastern parts of the Maritime Continent. The rainfall distribution for Jun 2017 is shown in Figure 1.

figure1

Figure 1: Daily average rainfall for the ASEAN region in Jun 2017. (Source: JAXA Global Satellite Mapping of Precipitation).

figure2

Figure 2: Percentage of Normal Rainfall for Jun 2017. The rainfall data Jun be less representative for areas with low density of rainfall network.

1.2    In June 2017, rainfall was above normal over Myanmar, parts of Vietnam and southern Philippines. In the southern ASEAN region, near-normal to above-normal rainfall prevailed over most parts of the region. However, rainfall was below-normal in northern and southern Sumatra. Figure 2 shows the percentage normal of rainfall for June 2017.

1.3    The prevailing winds during June 2017 were predominantly from the south or southwest in the northern ASEAN region. In the southern ASEAN region, prevailing winds blew from the southeast or south-southwest. There was no significant wind anomaly in the region except for an easterly anomaly over southern Philippines and a southerly anomaly over Myanmar, which could have contributed to the wetter-than-usual conditions in these areas. Figure 3 shows the average and anomalous winds at 5000 feet.

figure3a

figure3b

Figure 3: 5000 ft average winds (left) and anomaly (right) for Jun 2017.

1.4    The equatorial Pacific Ocean’s sea-surface temperature (SST) over the Nino3.4 region continued to remain at neutral (neither El Niño nor La Niña) values. Atmospheric indicators such as cloudiness and winds over the equatorial Pacific were consistent with neutral El Niño Southern Oscillation (ENSO) conditions.

1.5    In June 2017, the Madden Julian Oscillation (MJO) was in Phase 3 for a few days and weakened rapidly in the subsequent days. The MJO remained in a non-discernible state until 9 June 2017. It emerged in Phase 8 and Phase 1 during the second and third week of June 2017 respectively before weakening again. There was no MJO signal until the end of June 2017. Overall, the MJO did not contribute significantly to the weather patterns over the Maritime Continent in June 2017.

figure4

Figure 4: The MJO phase diagram for Jun 2017. The MJO phase diagram illustrates the movement of the MJO through different phases, which correspond to different locations along the equator. The distance of the index from the centre of the diagram is correlated with the strength of MJO. When the index falls within the circle, the MJO is considered weak or no signal exhibited. (Source: Bureau of Meteorology)

2.   Review of Land/Forest Fires and Smoke Haze Situation

2.1    In June 2017, hotspot activities in the northern ASEAN region were generally subdued due to the occurrence of increased rainfall brought by the onset of the Southwest Monsoon season.

2.2    In the southern ASEAN region, the number of hotspots detected remained low as wet weather conditions continued to persist, particularly over Sumatra and Kalimantan. Nonetheless, isolated hotspots with localised and short-lived smoke plumes were still observed in parts of Sumatra on a few days. Satellite images depicting some of the hotspot activities over parts of the ASEAN region during June 2017 are shown in Figure 5 – Figure 9.

figure5

Fig. 5: NOAA-19 satellite image on 3 June 2017 shows hotspot activities subdued by prevailing wet weather conditions in Kalimantan.

figure6

Fig. 6: NOAA-19 satellite image on 7 June 2017 shows isolated hotspots detected in northern and western parts of Sumatra.


figure7

Figure 7: NOAA-19 satellite image on 7 June 2017 shows increasing shower activities over the Mekong sub-region.

figure8

Figure 8: NOAA-19 satellite image on 23 June 2017 shows extensive shower activities and cloudy conditions over Sumatra.

figure9

Figure 9: NOAA-19 satellite image on 30 June 2017 shows wet weather conditions prevailing over Myanmar.

2.3    The hotspot distribution charts and daily hotspot charts for Jun 2017 are shown in Figure 10, Figure 11 and Figure 12 respectively.

figure10

Figure 10: Figure 10: NOAA-19 hotspots distribution in Jun 2017.

figure11

Figure 11: Hotspot Counts in Cambodia, Lao PDR, Thailand, Vietnam and Myanmar in Jun 2017.

figure12

Figure 12: Hotspot Counts in Sumatra, Borneo and Peninsular Malaysia in Jun 2017.


3.   Status of El Niño/La Niña and Indian Ocean Dipole

3.1    International climate centres indicate that the tropical Pacific Ocean will continue to warm gradually in the second half of 2017, and favors neutral ENSO conditions over El Niño.

3.2    Despite the low likelihood of an El Niño developing, periods of dry weather condition are expected and could lead to the occurrence of transboundary haze in the region.

3.3    Typically, El Niño brings drier-than-normal rainfall conditions to most parts of Southeast Asia, except over the near-equatorial region where the impact is less pronounced during the Northeast Monsoon season. During La Niña events, the opposite, i.e wetter-than-normal condition, normally occurs. Locally specific impact differs from place to place and for different seasons.

3.4    In June 2017, the Indian Ocean Dipole (IOD) has showed signs of transitioning into a positive IOD event although the IOD index continued to remain in the neutral state (Figure 13). In the next few months, based on international climate models, the IOD is forecast to remain neutral, with possibility that a positive IOD may develop toward the end of the year.

figure13

Figure 13: Indian Ocean Dipole (IOD) index time series. The IOD index is at the neutral level for Jun 2017. (Source: Bureau of Meteorology).

June 13, 2017

Review of Regional Weather and Smoke Haze for May 2017

Review of Regional Weather and Smoke Haze for May 2017

Print Version

1.   Review of Regional Weather Conditions in May 2017

1.1    May 2017, inter-monsoon conditions, characterised by light winds and afternoon shower activities, prevailed over the ASEAN region. During this period, rainfall activities increased over the northern ASEAN region. In the southern ASEAN region, drier weather conditions began to set in over the surrounding region of Java Sea. The rainfall distribution for May 2017 is shown in Figure 1.

Figure 1: Daily average rainfall for the ASEAN region in May 2017. (Source: JAXA Global Satellite Mapping of Precipitation).

Figure 2: Percentage of Normal Rainfall for May 2017. The rainfall data may be less representative for areas with low density of rainfall network.

1.2    In May 2017, most parts of the ASEAN region received near normal to above normal rainfall. In particular, rainfall was above normal over the eastern parts of the Philippines, southern Vietnam, Thailand, and over most parts of Sumatra and Kalimantan. Figure 2 shows the percentage normal of rainfall for May 2017.

1.3    The prevailing winds during May 2017 were predominantly from the southeast or south in the northern ASEAN region. In the southern ASEAN region, prevailing winds continued to remain light but blew from the southeast or southwest. An anomalous cyclonic circulation observed over the Andaman Sea brought enhanced rainfall activities over southern Thailand. Figure 3 shows the average and anomalous winds at 5000 feet.

Figure 3: 5000 ft average winds streamlines (left) and anomaly (right) for May 2017.

1.4    In Bay of Bengal, a low pressure system began to develop on 28 May and quickly strengthened into Cyclone Mora the next day. As the cyclone tracked northward toward Bangladesh, it brought strong winds and heavy rains over Arakan and Chin states in Myanmar. Cyclone Mora eventually made landfall in Bangladesh on 30 May and dissipated the next day.

1.5    The equatorial Pacific Ocean’s sea-surface temperature (SST) over the Nino3.4 region remained at neutral (neither El Niño nor La Niña) values. Atmospheric indicators such as cloudiness and winds over the equatorial Pacific were in the near average conditions.

1.6    In the first half of May 2017, the Madden Julian Oscillation (MJO) , in Phase 8 and Phase 1, did not have significant impact on the weather patterns in the Maritime Continent. The MJO subsequently weakened and was non-discernible during the third week of May. By the last week of May, the MJO redeveloped and emerged in Phase 2 and 3, which brought enhanced rainfall activities particularly over the surrounding region of Indian Ocean and Andaman Sea.

Figure 4: The MJO phase diagram for May 2017. The MJO phase diagram illustrates the movement of the MJO through different phases, which correspond to different locations along the equator. The distance of the index from the centre of the diagram is correlated with the strength of MJO. When the index falls within the circle, the MJO is considered weak or no signal exhibited. (Source: Bureau of Meteorology)

2.   Review of Land/Forest Fires and Smoke Haze Situation

2.1    In the northern ASEAN region, isolated to scattered hotspots with localised smoke haze were observed in the northern half of Myanmar, Lao PDR and Vietnam in early May 2017. Increased shower activities over the northern ASEAN region in the second week of May 2017 signalled an end to the traditional dry season. The hotspot activities in the region were then generally subdued by shower activities.

2.2    In the southern ASEAN region, hotspot activities remained subdued due to wet weather conditions. Nonetheless, isolated hotspots were detected in parts of Sumatra on some days. Satellite images depicting some of the hotspot activities over parts of the ASEAN region during May 2017 are shown in Figure 5 – Figure 9.

Fig. 5: NOAA-19 satellite image on 3 May 2017 shows scattered hotspots and localised smoke haze in northern Lao PDR and Vietnam.

Fig. 6: NOAA-19 satellite image on 14 May 2017 shows scattered shower activities prevailed over the southern ASEAN region.


Figure 7: NOAA-19 satellite image on 15 May 2017 shows hotspot activities in the northern ASEAN region subdued by wet weather conditions.

Figure 8: NOAA-19 satellite image on 29 May 2017 shows enhanced rainfall activities in Myanmar due to the influence of Cyclone Mora over the Bay of Bengal.

Figure 9: NOAA-19 satellite image on 31 May 2017 shows prevailing wet weather conditions over Sumatra.

2.3    The hotspot distribution charts and daily hotspot charts for May 2017 are shown in Figure 10, Figure 11 and Figure 12 respectively.

Figure 10: Figure 10: NOAA-19 hotspots distribution in May 2017.

Figure 11: Hotspot Counts in Cambodia, Lao PDR, Thailand, Vietnam and Myanmar in May 2017.

Figure 12: Hotspot Counts in Sumatra, Borneo and Peninsular Malaysia in May 2017.


3.   Status of El Niño/La Niña and Indian Ocean Dipole

3.1    International climate centres are projecting a near equal chance of the El Niño Southern Oscillation (ENSO) remaining neutral and a chance of weak El Niño developing in the latter half of the year.

3.2    Should an El Niño develop, the conditions are expected to be weak and the impact over the Maritime Continent is unlikely to be significant.

3.3    Typically, El Niño brings drier-than-normal rainfall conditions to most parts of Southeast Asia, except over the near-equatorial region where the impact is less pronounced during the Northeast Monsoon season. During La Niña events, the opposite, i.e wetter-than-normal condition, normally occurs. Locally specific impact differs from place to place and for different seasons.

3.4    In May 2017, the Indian Ocean Dipole (IOD) index continued to remain at neutral levels (Figure 13). In the next few months, based on international climate models, the IOD is forecast to remain neutral, with some chance that a positive IOD may develop toward the end of the year. The IOD is unlikely have a significant influence on the weather over the ASEAN region for the next few months.

Figure 13: Indian Ocean Dipole (IOD) index time series. The IOD index is at the neutral level for May 2017.

May 15, 2017

Review of Regional Weather and Smoke Haze for Apr 2017

Review of Regional Weather and Smoke Haze for Apr 2017

Print Version

1.   Review of Regional Weather Conditions in April 2017

1.1    Inter monsoon conditions, characterised by afternoon showers and winds that are generally light and variable in direction, prevailed over the region in April 2017. During the month, there was a gradual increase in rainfall over parts of the Mekong sub-region, mostly over Thailand, Cambodia and central Vietnam. Wet weather conditions continued to persist in the southern ASEAN region. The rainfall distribution for April 2017 is shown in Figure 1.

figure1

Figure 1: Daily average rainfall for the ASEAN region in April 2017. (Source: JAXA Global Satellite Mapping of Precipitation).

figure2

Figure 2: Percentage of Normal Rainfall for April 2017.

1.2    In April 2017, Myanmar, Vietnam and Lao PDR received near-normal to above-normal rainfall. However, over the eastern parts of Thailand and Lao PDR below-normal rainfall was recorded. Near-normal rainfall was received in northern parts of the Philippines while rainfall was above-normal in central and southern Philippines. In the southern ASEAN region, rainfall was near-normal except in northern Sumatra, east coast of Peninsular Malaysia and parts of Sarawak where below-normal rainfall was received . Figure 2 shows the percentage normal of rainfall for April 2017.

1.3    The prevailing winds during April 2017 were predominantly from the east or south-southwest over the northern ASEAN region. In the southern ASEAN region, prevailing winds were light but continued to blow mainly from the west or northwest. Similar to the conditions in March 2017, weak westerly wind anomalies were observed over the equatorial region between the Indian Ocean and the eastern parts of the Indonesian Archipelago. An anomalous cyclonic circulation over southern Thailand also contributed to enhanced rainfall activity in April 2017. Figure 3 shows the average and anomalous winds at 5000 feet.

figure3a

figure3b

Figure 3: 5000 ft average winds streamlines (left) and anomaly (right) for April 2017.

1.4    On 13 April, a low pressure system developed in the Bay of Bengal and strengthened into Tropical cyclone Maarutha on 15 April 2017. Cyclone Maarutha made landfall in Myanmar the next day bringing widespread showers over most parts of Myanmar. This contributed to about 50 – 400 % of the long-term average rainfall in April over parts of western Myanmar. The cyclone dissipated quickly into a low pressure system on 17 April 2017.

1.5    The equatorial Pacific Ocean’s sea-surface temperature (SST) over the Nino3.4 region continued to warm but remained at neutral (neither El Niño nor La Niña) values. Most of the atmospheric indicators over the equatorial Pacific were in the near average conditions.

1.6    In the first half of April 2017, the Madden Julian Oscillation (MJO) was non-discernible. By late April 2017, while the MJO gradually strengthened, it remained at weak levels and did not have any significant influence on the weather patterns over the southern ASEAN region.

figure4

Figure 4: The MJO phase diagram for April 2017. The MJO phase diagram illustrates the movement of the MJO through different phases, which correspond to different locations along the equator. The distance of the index from the centre of the diagram is correlated with the strength of MJO. When the index falls within the circle, the MJO is considered weak or no signal exhibited. (Source: Bureau of Meteorology).

2.   Review of Land/Forest Fires and Smoke Haze Situation

2.1    In the northern ASEAN region, an escalation of hotspot activities was observed mainly in Myanmar, Thailand and Lao PDR. During the first half of the month, widespread hotspots with smoke haze were detected along the western Arakan Ranges, eastern border of Myanmar, northern Thai provinces and northern parts of Lao PDR. Nonetheless, the passage of Tropical Cyclone Maarutha brought increased shower activities which helped alleviate the hotspot situation in Myanmar and northern Thailand.

2.2    In the early part of the second half of April 2017, brief periods of dry weather conditions led to an increase in the number of hotspots detected in northern Lao PDR. Moderate smoke haze was seen emanating from these hotspots. However, the fire hotspots were short-lived as they were subdued by onset of shower activities around end April 2017.2.3    In the southern ASEAN region, hotspot activities remained generally subdued due to the rainy weather in the region. Satellite images depicting some of the hotspot activities over parts of the ASEAN region during April 2017 are shown in Figure 5 – Figure 9.

figure5

Fig. 5: NOAA-19 satellite image on 10 April 2017 shows hotspots with smoke detected in various parts of Myanmar.

figure6

Fig. 6:NOAA-19 satellite image on 11 April 2017 shows moderate smoke haze emanating from a cluster of hotspots in Lao PDR.


figure7

Figure 7: NOAA-19 satellite image on 16 April 2017 shows Tropical Cyclone Maarutha which brought widespread rains that helped to subdue hotspots in Myanmar.

figure8

Figure 8: NOAA-19 satellite image on 26 April 2017 shows hotspot activities remained subdued in the southern ASEAN region.

figure9

Figure 9: NOAA-19 satellite image on 28 April 2017 shows a reduction in the number of hotspots detected in the Mekong sub-region due to increased shower activities.

2.4    The hotspot distribution charts and daily hotspot charts for April 2017 are shown in Figure 10, Figure 11 and Figure 12 respectively.

figure10

Figure 10: Figure 10: NOAA-19 hotspots distribution in April 2017.

figure11

Figure 11: Hotspot Counts in Cambodia, Lao PDR, Thailand, Vietnam and Myanmar in April 2017.

figure12

Figure 12: Hotspot Counts in Sumatra, Borneo and Peninsular Malaysia in April 2017.


3.   Status of El Niño/La Niña and Indian Ocean Dipole

3.1    Most models from major climate centres indicate the tropical Pacific Ocean will continue to gradually warm in the next 6 months. Forecasts suggest El Niño conditions being slightly favoured over neutral conditions from July-August-September.

3.2    However, the seasonal prediction model outlooks of El Niño at this time of the year are the least skillful all year round, a more confidence assessment of El Niño risk would be available from June onwards.

3.3    Typically, El Niño brings drier-than-normal rainfall conditions to most parts of Southeast Asia, except over the near-equatorial region where the impact is less pronounced during the Northeast Monsoon season. During La Niña events, the opposite, i.e wetter-than-normal condition, normally occurs. Locally specific impact differs from place to place and for different seasons.

3.4    In April 2017, the Indian Ocean Dipole (IOD) index has increased slightly from previous month but continued to remain at neutral levels (Figure 13). In the next few months, based on international climate models, the IOD is forecast to remain neutral, with some chance that a positive IOD may develop later in the year. The IOD is unlikely have a significant influence on the weather over the ASEAN region for the next few months.

figure13

Figure 13: Indian Ocean Dipole (IOD) index time series. The IOD index is at the neutral level for April 2017. (Source: Bureau of Meteorology).

April 10, 2017

Review of Regional Weather and Smoke Haze for Mar 2017

Review of Regional Weather and Smoke Haze for Mar 2017

Print Version

1.   Review of Regional Weather Conditions in March 2017

1.1    The Northeast Monsoon conditions in the region gave way to inter-monsoon conditions in the second half of March 2017. During the month, there was a gradual increase of shower activities over parts of the Mekong sub-region, particularly over Thailand, Cambodia and central Vietnam was observed while over most parts of the southern ASEAN region, wet weather conditions continued to prevail. The rainfall distribution for March 2017 is shown in Figure 1.

figure1

Figure 1: Daily average rainfall for the ASEAN region in March 2017. (Source: JAXA Global Satellite Mapping of Precipitation).

figure2

Figure 2: Percentage of Normal Rainfall for March 2017. The rainfall data may be less representative for areas with low density of rainfall network

1.2    In March 2017, rainfall was near to above-normal over most parts of the northern ASEAN region, except in parts of Myanmar, Cambodia and southern Vietnam where below-normal rainfall was received. Likewise in most parts of the Philippines, near- to above-normal rainfall prevailed with most of the rainfall affecting the Mindanao area. In the southern ASEAN region, rainfall received was mostly near to above-normal, and in the second half of March 2017, parts of West Java and Peninsular Malaysia were affected by floods due to the occurrence of heavy thunderstorm activities on some days. Figure 2 shows the percentage normal of rainfall for March 2017.

1.3    The prevailing winds during the month were predominantly from the north-east or east over the northern ASEAN region, and from the west or northwest over the southern ASEAN region. In the second half of March 2017, there was a gradual weakening of winds over the ASEAN region around and north of the Equator. Westerly wind anomalies prevailed over the equatorial region between the Indian Ocean and the eastern parts of Indonesian Archipelago. The anomalous convergence observed over the northern parts of Borneo and southern Philippines could have contributed to above-normal rainfall over those areas. Figure 3 shows the average and anomalous winds at 5000 feet.

figure3a

figure3b

Figure 3: 5000 ft average winds streamlines (left) and anomaly (right) for March 2017.

1.4    The cool anomalies of the equatorial Pacific Ocean’s sea-surface temperature (SST) over the Niño3.4 region further weakened towards neutral (neither El Niño nor La Niña) values, and most of the atmospheric indicators over the equatorial Pacific were in the near average conditions.

1.5    In early March 2017, the Madden Julian Oscillation (MJO) progressed through Phase 3 to Phase 4 in early March 2017, and this was a contributing factor to the increased rainfall received over the Indonesian Archipelago. The strength of the MJO gradually weakened towards mid-March 2017, and did not have a significant influence on the rainfall in the second half of the month.

figure4

Figure 4: The MJO phase diagram for March 2017. The MJO phase diagram illustrates the movement of the MJO through different phases, which correspond to different locations along the equator. The distance of the index from the centre of the diagram is correlated with the strength of MJO. When the index falls within the circle, the MJO is considered weak or no signal exhibited. (Source: Bureau of Meteorology)<

2.   Review of Land/Forest Fires and Smoke Haze Situation

2.1    In March 2017, the hotspot activities in the northern ASEAN region remained active under the prevailing dry weather conditions. Large clusters of hotspots were detected in Myanmar and northern Thailand compared to February 2017. Most of the hotspots and areas of smoke haze were detected close to the border of Myanmar and Thailand, in the provinces of Mae Hong Son, Chiang Rai and Kamphaeng Phet. In the second half of March 2017, there was a further deterioration in the air quality in northern Thailand, and the PM10 readings exceeded 150ug/m3 (Unhealthy range) on several days in Mae Hong Son and Chiang Rai provinces. In Lao PDR, a high density of hotspots was detected in Xiangkhoang and Xaignabouri pronvinces. On the other hand, there was an increase in shower activities in Cambodia during the month which helped to ease the hotspot situation there.

2.2    In contrast, hotspot activities in the southern ASEAN region remained low and were mostly subdued due frequent shower activities in the region.

2.3    Satellite images depicting some of the hotspot activities over parts of the ASEAN region during March 2017 are shown in Figure 5 – Figure 9.

figure5

Fig. 5: NOAA-19 satellite image on 3 March 2017 shows widespread hotspots with smoke haze in parts of Myanmar.

figure6

Fig. 6:NOAA-19 satellite image on 14 March 2017 shows slight to moderate smoke haze over parts of northern Thailand.


figure7

Figure 7: NOAA-19 satellite image on 14 March 2017 shows occurrence of shower activities which has helped to subdue the hotspot activities over the southern ASEAN region.

figure8

Figure 8: NOAA-19 satellite image on 28 March 2017 shows scattered hotspots with smoke haze in Myanmar.

figure9

Figure 9: NOAA-19 satellite image on 31 March 2017 shows more occurrence of shower activities over the Mekong sub-region.

2.4    The hotspot distribution charts and daily hotspot charts for March 2017 are shown in Figure 10, Figure 11 and Figure 12 respectively.

figure10

Figure 10: Figure 10: NOAA-19 hotspots distribution in March 2017.

figure11

Figure 11: Hotspot Counts in Cambodia, Lao PDR, Thailand, Vietnam and Myanmar in March 2017.

figure12

Figure 12: Hotspot Counts in Sumatra, Borneo and Peninsular Malaysia in March 2017.


3.   Status of El Niño/La Niña and Indian Ocean Dipole

3.1    Most models from major climate centres indicate the tropical Pacific Ocean will continue to gradually warm over the next 6 months, and there is an increasing chance that weak El Niño conditions could develop in the second half of 2017.

3.2    As the seasonal prediction model outlooks of El Niño at this time of the year is known to have the least skill, a more confidence assessment of El Niño risk would be available around mid-2017 onwards.

3.3    Typically, El Niño brings drier-than-normal rainfall conditions to most parts of Southeast Asia, except over the near-equatorial region where the impact is less pronounced during the Northeast Monsoon season. During La Niña events, the opposite, i.e wetter-than-normal condition, normally occurs. Locally specific impact differs from place to place and for different seasons.

3.4    In March 2017, the Indian Ocean Dipole (IOD) index was at neutral levels (Figure 13). In the next few months, based on international climate models, the IOD is forecast to remain neutral and it would unlikely have a significant influence on the weather over the ASEAN region. The formation of IOD typically starts around May or June, and peaks between August and October before decaying rapidly between December and April.

figure13

Figure 13: Indian Ocean Dipole (IOD) index time series. The IOD index is at the neutral level for March 2017. (Source: Bureau of Meteorology).

March 10, 2017

Review of Regional Weather and Smoke Haze for Feb 2017

Review of Regional Weather and Smoke Haze for Feb 2017

Print Version

1.   Review of Regional Weather Conditions in February 2017

1.1    The Northeast Monsoon conditions prevailed over the ASEAN region in February 2017. Dry weather conditions persisted over most areas of the Mekong sub-region, except over parts of Thailand and Cambodia where brief periods of showers were observed. During the month, the monsoon rain band was between the Equator and 15 S, and rainy weather conditions were experienced over most parts of the southern ASEAN region. The rainfall distribution for February 2017 is shown in Figure 1.

figure1

Figure 1: Daily average rainfall for the ASEAN region in March 2017. (Source: JAXA Global Satellite Mapping of Precipitation).

figure2

Figure 2: Percentage of Normal Rainfall for March 2017. The rainfall data may be less representative for areas with low density of rainfall network.

1.2    In February 2017, rainfall was below-normal in parts of Myanmar, northern and central Thailand, Lao PDR and Cambodia. Rainfall was above-normal over most parts of Vietnam and the Philippines. In contrast, rainfall was mostly near-normal to above-normal in the southern ASEAN region. The percentage normal of rainfall for February 2017 is shown in Figure 2.

1.3    Most of the rainfall activities in February 2017 was concentrated between the the Equator and the region around Java, and Mindanao, the Philippines (Figure 1). In mid-February, a strong monsoon surge brought a strengthening of winds and enhanced rainfall activities over the southern ASEAN region. The heavy rainfall associated with the monsoon surge fell mainly over coastal areas of Sarawak and the Java Sea. During the second half of February, some parts of Java as well as Jakarta Indonesia, were affected by heavy rains and floods due to localised thunderstorm activities.

1.4    In February 2017, north-easterly winds prevailed over the northern ASEAN region while winds in the southern ASEAN region blew predominantly from the west or northwest. Figure 3 shows the average and anomalous winds at 5000 feet. During the month, winds from the northern and southern hemispheres converged between 5 S and 10 S, and westerly or south-westerly wind anomalies prevailed over the Java Sea and the eastern parts of the Maritime Continent. In addition, the occurrence of cyclonic circulation anomalies over the Western Pacific Ocean contributed to the above-normal rainfall over the Philippines.

figure3a

figure3b

Figure 3: 5000 ft average winds streamlines (left) and anomaly (right) for February 2017.

1.5    The cool anomalies of the equatorial Pacific Ocean’s sea-surface temperature (SST) over the Niño 3.4 region weakened further but remained within the neutral (neither El Nino nor La Nina) thresholds. Most of the atmospheric conditions over the equatorial Pacific were in near average conditions, except for cloudiness and rainfall over the central and western tropical Pacific which remained indicative of weak La Niña conditions.

1.6    The Madden Julian Oscillation (MJO) was active and strong in February 2017 and is likely to have played a significant role on the rainfall over the tropical region during this period. In the first week of February 2017, the MJO was in Phase 4-5 and brought enhanced shower activities over the southern parts of Maritime Continent. In the second and third week of February 2017, the MJO strengthened and propagated through Phase 6-8, which contributed to less convective activities over the western Maritime Continent including parts of Sumatra and Peninsular Malaysia. The MJO continued its passage into Phase 1-2 towards the end of February 2017.

figure4

Figure 4: The MJO phase diagram for March 2017. The MJO phase diagram illustrates the movement of the MJO through different phases, which correspond to different locations along the equator. The distance of the index from the centre of the diagram is correlated with the strength of MJO. When the index falls within the circle, the MJO is considered weak or no signal exhibited. (Source: Bureau of Meteorology)

2.   Review of Land/Forest Fires and Smoke Haze Situation

2.1    In the Mekong Sub-region, hotspot activities persisted mainly in Thailand and Cambodia during the first half of February 2017. Visible smoke plumes and moderate haze were observed in parts of northern Cambodia on a few days. In the latter half of the month, brief periods of shower activities helped to prevent further escalations in hotspot activity over Cambodia. However, in Myanmar, there was a deterioration in the fire situation with the prevailing dry weather conditions, and led to an increase in the number of detected hotspots.

2.2    The hotspots in Myanmar were detected mainly along the Arakan ranges and near the borders between Myanmar and northern Thailand. Reduced visibility and elevated air quality readings were reported in some stations over northern Thailand on several days. In Mae Hong Son, the PM10 reading exceeded 150 ug/m3 (Unhealthy range) on 27 February 2017.
2.3    Hotspot activities in the southern ASEAN region remained largely subdued due to the prevailing wet weather conditions.

2.4    Satellite images depicting some of the hotspot activities over parts of the ASEAN region during February 2017 are shown in Figure 5 – Figure 9.

figure5

Fig. 5: NOAA-19 satellite image on 5 March 2017 shows scattered hotspots with smoke haze observed in central Thailand and northern Cambodia.

figure6

Fig. 6:NOAA-19 satellite image on 13 March 2017 shows scattered hotspots detected in parts of Myanmar.


figure7

Figure 7: NOAA-19 satellite image on 23 March 2017 shows elevated hotspot activities detected in northern Thailand. Fire hotspots in Cambodia and Vietnam were subdued due to shower activities.

figure8

Figure 8: NOAA-19 satellite image on 24 March 2017 shows few clusters of hotspots with smoke haze detected in Myanmar.

figure9

Figure 9: NOAA-19 satellite image on 24 March 2017 shows hotspot activities subdued over the southern ASEAN region due to wet weather conditions.

2.5    The hotspot distribution charts and daily hotspot charts for February 2017 are shown in Figure 10, Figure 11 and Figure 12 respectively.

2.6    In February 2017, a high density of hotspots was observed in the northern ASEAN region, particularly over Myanmar, Thailand and Cambodia. A large number of hotspots persisted over the Myanmar-Thailand border between Naypyitaw, Myanmar and Mae Hong Son province Thailand. In Thailand, most of the hotspots were detected in the areas close to Kamphaeng Phet, Phetchabun and Sakon Nakhon provinces. In Cambodia, large clusters of hotspots persisted over the northern half of the country between Siem Reap and Mondulkiri. In the southern ASEAN region, the number of hotspots detected remained low.

figure10

Figure 10: Figure 10: NOAA-19 hotspots distribution in March 2017.

figure11

Figure 11: Hotspot Counts in Cambodia, Lao PDR, Thailand, Vietnam and Myanmar in March 2017.

figure12

Figure 12: Hotspot Counts in Sumatra, Borneo and Peninsular Malaysia in March 2017.


3.   Status of El Niño/La Niña and Indian Ocean Dipole

3.1    Most climate models indicate the tropical Pacific will continue to remain at neutral levels but may warm gradually from March 2017 onwards. Given the observations and outlook, an extension of La Niña is the least likely scenario until mid-2017.

3.2    Few models suggest that the warming may reach El Niño levels again in 3Q 2017. However, as the seasonal prediction model outlooks of El Nino at this time of the year is known to have the least skill, a more confident assessment of El Niño risk will be available around mid-2017.

3.3    Typically, El Niño brings drier-than-normal rainfall conditions to most parts of Southeast Asia, except over the near-equatorial region where the impact is less pronounced during the Northeast Monsoon season. During La Niña events, the opposite, i.e wetter-than-normal condition, normally occurs. Locally specific impact differs from place to place and for different seasons.

3.4    In February 2017, the Indian Ocean Dipole (IOD) index increased slightly but continued to remain at neutral levels, as shown in Figure 13. International climate models forecast the IOD to remain neutral and would unlikely have a significant influence on the weather over the region for the next few months. The formation of IOD typically starts around May or June, and peaks between August and October before decaying rapidly between December and April.

figure13

Figure 13: Indian Ocean Dipole (IOD) index time series. The IOD index is at the neutral level for March 2017. (Source: Bureau of Meteorology).

February 17, 2017

Review of Regional Weather and Smoke Haze for Jan 2017

Review of Regional Weather and Smoke Haze for Jan 2017

Print Version

1.   Review of Regional Weather Conditions in January 2017

1.1    The prevailing Northeast Monsoon conditions continued into January 2017. Dry weather conditions interspersed with brief periods of showers prevailed over the Mekong sub-region. In southern Thailand and the Philippines, wet weather conditions prevailed. With the monsoon rain band over the equatorial region between 10 N and 15 S, most parts of the southern ASEAN region experienced wet weather conditions. The rainfall distribution for January 2017 is shown in Figure 1.

figure1

Figure 1: Daily average rainfall for the ASEAN region in January 2017. (Source: JAXA Global Satellite Mapping of Precipitation).

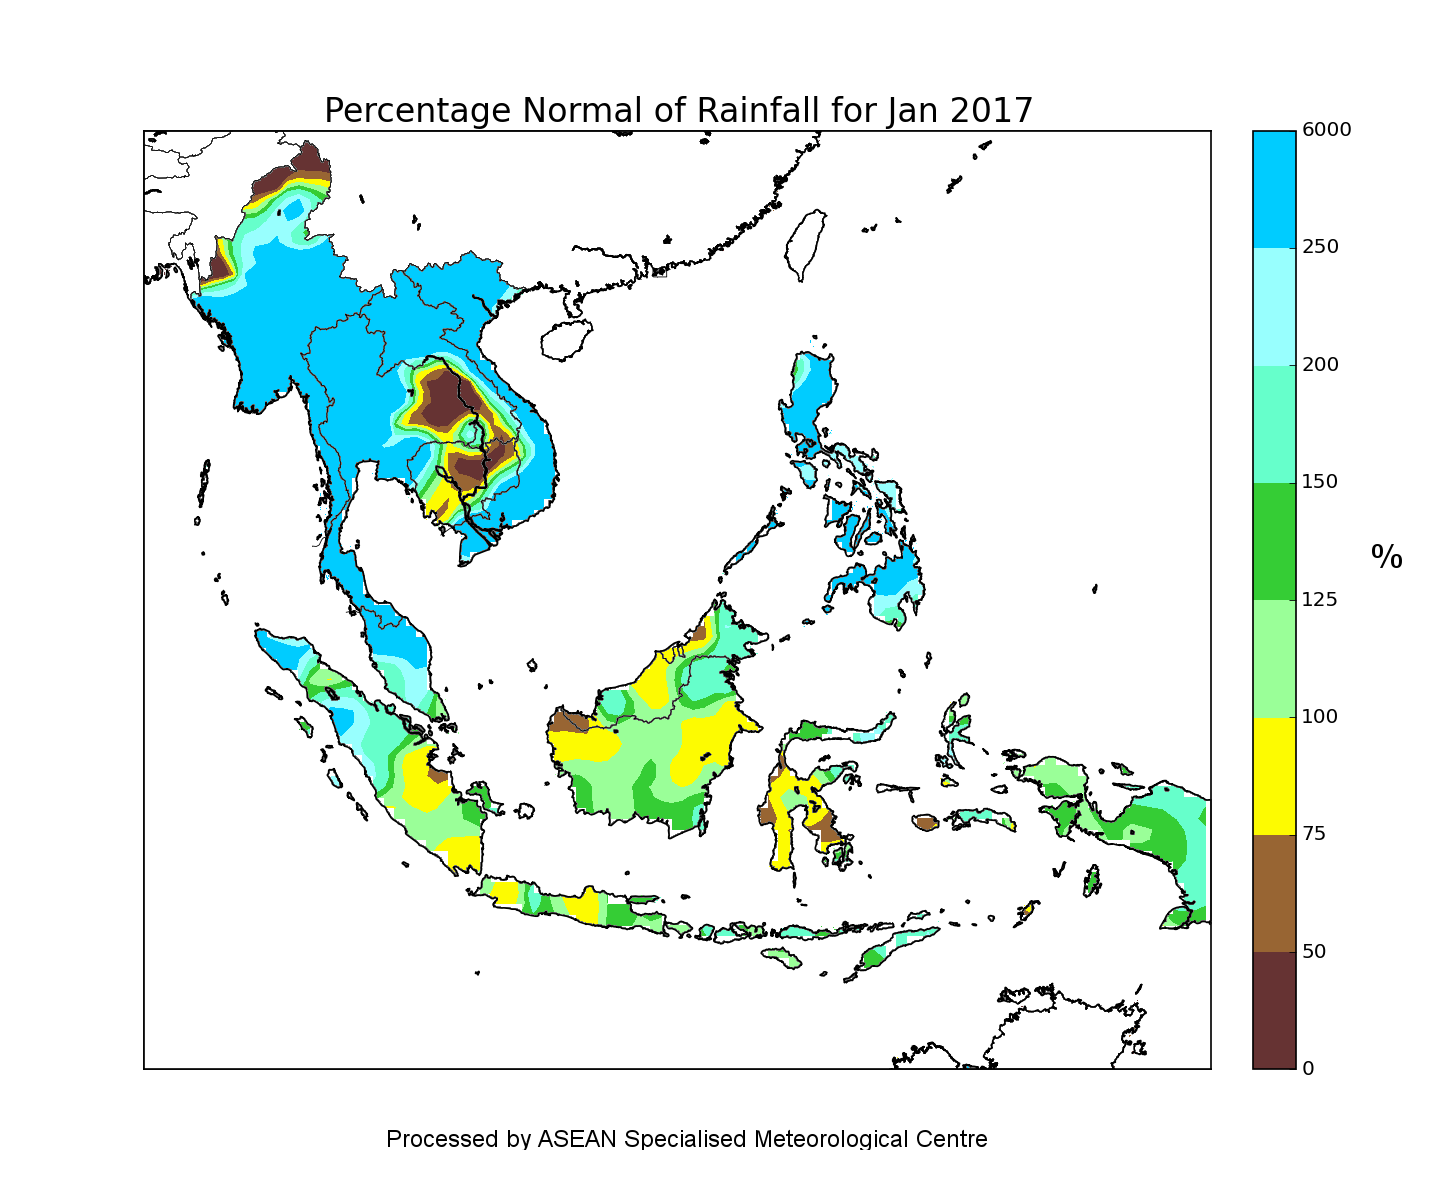
figure2

Figure 2: Percentage of Normal Rainfall for January 2017. The rainfall data may be less representative for areas with low density of rainfall network.

1.2    In January 2017, rainfall was above-normal over most parts of the northern ASEAN region except in Cambodia and the eastern parts of Thailand where rainfall was below-normal. In the southern ASEAN region, rainfall was near-normal to above-normal. The percentage normal of rainfall for January 2017 is shown in Figure 2.

1.3    The rainfall in January 2017 was distributed mainly across the equatorial region. Heavy rains affected parts of southern Thailand, Malaysia, southern Philippines and the surrounding region of Java Sea. In southern Philippines, a slow moving low-pressure system over the Mindanao and Visayas areas brought heavy rainfall to these areas. In addition, several monsoon surges, characteristic of the Northeast Monsoon season affected the region. Monsoon surges refer to the strengthening of winds over the South China Sea due to the intensification of high pressure system over northern China. In the first week of January, a monsoon surge brought heavy rains and caused widespread flooding in southern Thailand that affected over 12 provinces. Between 20 and 24 January, a second monsoon surge brought heavy rain showers that affected the near-equatorial region including the east coast of Peninsular Malaysia, Singapore and parts of central Sumatra.

1.4    In January 2017, northeasterly winds prevailed in the northern ASEAN region while northwesterly and westerly winds blew predominantly in the southern ASEAN region. The average and anomalous winds at 5000 feet are shown in Figure 3. Between the Equator and 10oS, there were large-scale westerly anomaly winds over an area extending from the Indian Ocean to the Java Sea. In addition, the presence of two distinct cyclonic circulations due to the formation of low pressure systems in the Andaman Sea and in southern Philippines brought well-above normal rainfall to the region.

figure3a

figure3b

Figure 3: 5000 ft average winds streamlines (left) and anomaly (right) for January 2017.

1.5    For the month, the equatorial Pacific Ocean’s sea surface temperature (SST) over the Niño 3.4 region was within neutral ENSO threshold values, and the atmospheric indicators such as the trade winds and cloudiness over the equatorial Pacific, indicated either weakening La-Niña or neutral conditions.

1.6    In the first half January 2017, the Madden Julian Oscillation (MJO) was weak or indiscernible and did not contribute significantly to the weather in the region. The MJO however, emerged from Phase 1 and progressed through Phase 2 to Phase 3 in the latter half of January. The passage of MJO through Phase 2 and 3 was likely to have enhanced the impact of monsoon surge which brought heavy rainfall over southern Thailand and east coast of Peninsular Malaysia between 20 and 24 January.

figure4

Figure 4: The MJO phase diagram for January 2017. The MJO phase diagram illustrates the movement of the MJO through different phases, which correspond to different locations along the equator. The distance of the index from the centre of the diagram is correlated with the strength of MJO. When the index falls within the circle, the MJO is considered weak or no signal exhibited. (Source: Bureau of Meteorology)

2.   Review of Land/Forest Fires and Smoke Haze Situation

2.1    In the Mekong sub region, hotspot activities were relatively low in the first half of January 2017. A few contributing factors could be due to the presence of cloud cover, obscuring detection by satellites, and occurrence of showers activities over parts of the northern ASEAN region which could have helped to subdue hotspot activities in parts of the northern ASEAN region. In the second half of January, dry weather conditions in the region brought a significant increase in the number of hotspots, in particular over Thailand and Cambodia. Clusters of scattered hotspots persisted in parts of central Thailand and the northern half of Cambodia. In addition, localised smoke plumes were seen to emanate from some of the hotspots detected.

2.2    In the southern ASEAN region, most of the hotspots were detected in central Sumatra where brief periods of dry weather conditions were experienced in the first half of January 2017. Overall, the hotspot activities in the regioin remained largely subdued due to the prevailing shower activities.2.3    Satellite images depicting some of the hotspot activities over parts of the ASEAN region during January 2017 are shown in Figure 5 – Figure 9.

figure5

Fig. 5: NOAA-19 satellite image on 9 January 2017 shows hotspot activities over the Mekong sub-region were relatively inactive in the first half of January due to shower activities.

figure6

Fig. 6: NOAA-19 satellite image on 10 January 2017 shows isolated hotspots emerged over parts of central Sumatra during brief period of dry weather.


figure7

Figure 7: NOAA-19 satellite image on 20 January 2017 shows isolated hotspots began to emerge in Myanmar.

figure8

Figure 8: NOAA-19 satellite image on 28 January 2017 shows a cluster of scattered hotspots detected over northern Cambodia. Localised smoke plumes were observed to emanate from some of the hotspots.

figure9

Figure 9: NOAA-19 satellite image on 30 January 2017 shows hotspot activities subdued over Kalimantan due to shower activities.

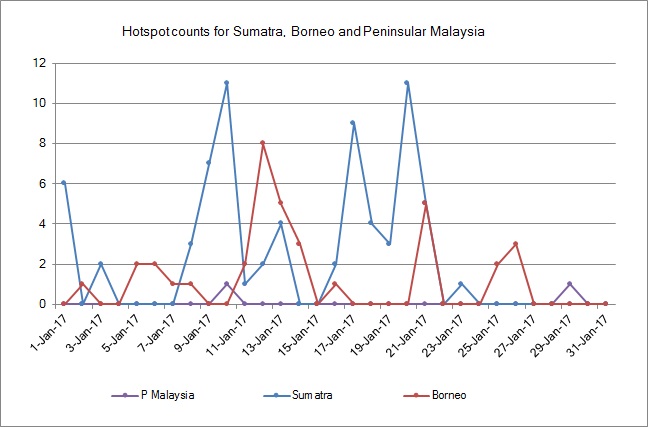
2.4    The hotspot distribution charts and daily hotspot charts for January 2017 are shown in Figure 10, Figure 11 and Figure 12 respectively.

2.5    In January 2017, there were several clusters of scattered hotspots detected in the northern ASEAN region (as shown in Figure 10). Most notably, a cluster of high density hotspots was detected in the northern half of Cambodia including the provinces of Preah Vihear, Kampong Thom, Kratie and Mondulkiri. Scattered hotspots were also detected in Myanmar, central Thailand and Lao PDR. In the southern ASEAN region, the overall number of hotspots detected remained low. Isolated hotspots were detected mainly in Sumatra, West Kalimantan and Sarawak.

figure10

Figure 10: Figure 10: NOAA-19 hotspots distribution in January 2017.

figure11

Figure 11: Hotspot Counts in Cambodia, Lao PDR, Thailand, Vietnam and Myanmar in January 2017.

figure12

Figure 12: Hotspot Counts in Sumatra, Borneo and Peninsular Malaysia in January 2017.


3.   Status of El Niño/La Niña and Indian Ocean Dipole

3.1    Climate models from major climate centres project neutral ENSO conditions in the coming season until May 2017, and the weak cool anomalies over the Niño 3.4 region to gradually weaken by April 2017.

3.2    Typically, La Niña brings wetter-than-normal rainfall conditions to most parts of Southeast Asia, and has a less pronounced impact on the weather over the near-equatorial region during the Northeast Monsoon season. Locally-specific impact differs from place to place and for different seasons.

3.3    In January 2017, the Indian Ocean Dipole (IOD) continued to remain at neutral levels, as shown in Figure 13. International climate models forecast the IOD to be neutral and would unlikely have a significant influence on the weather over the region for the next few months. The formation of IOD typically starts around May or June, and peaks between August and October before decaying rapidly between December and April.

figure13

Figure 13: Indian Ocean Dipole (IOD) index time series. The IOD index is at the neutral level for January 2017. (Source: Bureau of Meteorology).

January 12, 2017

Review of Regional Weather and Smoke Haze for Dec 2016

Review of Regional Weather and Smoke Haze for Dec 2016

Print Version

1.   Review of Regional Weather Conditions in December 2016

1.1    Northeast Monsoon conditions prevailed in December 2016. These conditions brought dry weather conditions interspersed with brief periods of showers to most parts of the northern ASEAN region. On the other hand, with the gradual southward migration of the monsoon rain band, the Northeast Monsoon brought wet weather conditions to the southern ASEAN region. The rainfall distribution for December 2016 is shown in Figure 1.

figure1

Figure 1: Daily average rainfall for the ASEAN region in December 2016. (Source: JAXA Global Satellite Mapping of Precipitation).

figure2

Figure 2: Percentage of Normal Rainfall for December 2016. The rainfall data may be less representative for areas with low density of rainfall network.

1.2    For December 2016, above-normal rainfall was recorded in southern Thailand, Vietnam and the Philippines while rainfall was below-normal in Myanmar, central Thailand, parts of Lao PDR and northern Vietnam. In the southern ASEAN region, rainfall was near-normal in most regions except in central Sumatra and western Java, where below-normal rainfall was recorded. The percentage normal of rainfall for December 2016 is shown in Figure 2.

1.3    The rainfall in December 2016 was distributed mainly in the equatorial region between 10N and 15S with several areas affected by heavy rainfall. A few northeast monsoon surges in December 2016 brought heavy rains to southern Thailand, central and southern parts of Vietnam and the east coast of Peninsular Malaysia. In addition, the presence of a low pressure system over the South China Sea in mid-December 2016 brought well above normal rainfall to the central and southern parts of Vietnam.

1.4    Over the Western Pacific Ocean, Typhoon Nock-Ten was first categorised as a tropical storm on 22 December 2016. It intensified further and tracked west-north-westward toward central Philippines before it made landfall on the eastern coast near Catanduanes Island on 25 December 2016. The typhoon then tracked westward and brought heavy rains and strong winds to the regions of Bikon and Calabarzon in central Philippines. ”Nock-Ten” moved over the South China Sea on 26 December and rapidly weakened into a tropical depression the next day.

1.5    In December 2016, the average and anomalous winds at 5000 feet (as in Figure 3), showed that north-easterly winds prevailing in the northern ASEAN region while westerlies prevailed in the southern ASEAN region. In the equatorial region of South China Sea, a cyclonic circulation was observed off the west coast of Sarawak and Sabah. This was due to the formation of Borneo vortices on some days in December, a feature which is typical during the Northeast Monsoon. The anomaly wind chart suggests that the anomalous circulation off the coast of southern Thailand is likely to be the primary cause of the well-above normal rainfall received in that region. The easterly anomaly brought below normal rainfall to most parts of the northern ASEAN region. Large-scale and persistent westerly anomaly winds observed across the equatorial region between 5 N and 10 S inhibited the incursion of the prevailing north-easterly flow across the equatorial region, contributing to the reduction of shower activities over Sumatra and parts of Java.

figure3a

figure3b

Figure 3: 5000 ft average winds streamlines (left) and anomaly (right) for December 2016.

1.6    In December 2016, the equatorial Pacific Ocean’s sea surface temperature (SST) over the Nino 3.4 region was near weak La Niña threshold values. However, the atmospheric variables, such as trade winds and cloudiness over the equatorial Pacific, showed conditions that were more consistent with neutral ENSO conditions.

figure4

Figure 4: The MJO phase diagram for December 2016. The MJO phase diagram illustrates the movement of the MJO through different phases, which correspond to different locations along the equator. The distance of the index from the centre of the diagram is correlated with the strength of MJO. When the index falls within the circle, the MJO is considered weak or no signal exhibited. (Source: Bureau of Meteorology)

1.7    In December 2016, the Madden Julian Oscillation (MJO) was weak or indiscernible and is unlikely to have significantly influenced the weather over the region.

2.   Review of Land/Forest Fires and Smoke Haze Situation

2.1    In December 2016, dry weather conditions interspersed with brief periods of showers prevailed in the Mekong sub-region. This led to a gradual increase of hotspots detected in most parts of the northern ASEAN region. However, the hotspots were mostly short-lived and the smoke haze observed was localised.

2.2    In the southern ASEAN region, hotspot activities were subdued by shower activities, except in central Sumatra where drier than usual weather conditions emerged. Nonetheless, the hotspots did not persist or give rise to the emission of significant smoke haze.2.3    Satellite images depicting some of the hotspot activities over parts of the ASEAN region during December 2016 are shown in Figure 5 – Figure 9.

figure5

Fig. 5: NOAA-19 satellite image on 1 December 2016 shows hotspots subdued as wet weather conditions prevailed over Kalimantan.

figure6

Fig. 6: NOAA-19 satellite image on 9 December 2016 shows isolated hotspots began to emerge in the northern ASEAN region, particularly over eastern Thailand and northern Vietnam.


figure7

Figure 7: NOAA-19 satellite image on 14 December 2016 shows isolated hotspots detected in central Sumatra.

figure8

Figure 8: NOAA-19 satellite image on 18 December 2016 shows isolated hotspots detected in eastern Thailand.

figure9

Figure 9: NOAA-19 satellite image on 23 December 2016 shows isolated hotspots detected in the surrounding region of Yangon, Myanmar.


2.4    The hotspot distribution charts and daily hotspot charts for December 2016 are shown in Figure 10, Figure 11 and Figure 12 respectively.

2.5    Most of the hotspots detected in December 2016 were mainly in the northern ASEAN region, with several clusters found in the coastal region of Myanmar, central Thailand and northern Vietnam (as shown in Figure 10). In the southern ASEAN region, the number of hotspots detected remained low except in central Sumatra where few clusters of hotspots were detected.

figure10

Figure 10: Figure 10: NOAA-19 hotspots distribution in December 2016.

figure11

Figure 11: Hotspot Counts in Cambodia, Lao PDR, Thailand, Vietnam and Myanmar in December 2016.


figure12

Figure 12: Hotspot Counts in Sumatra, Borneo and Peninsular Malaysia in December 2016.


3.   Status of El Niño/La Niña and Indian Ocean Dipole

3.1    Climate models from major climate centres are expecting the borderline La Niña conditions to weaken to neutral conditions in the upcoming season. The neutral conditions are forecast to then persist till mid-2017.

3.2    The region is currently experiencing Northeast Monsoon conditions. The impact of La Niña on the weather over the near-equatorial region is usually less pronounced during the Northeast Monsoon as compared to the Southwest Monsoon (Jun – Sep).

3.3    The Indian Ocean Dipole (IOD) continued to remain at neutral levels, as shown in Figure 13. International climate models indicate that the IOD is expected to remain in neutral condition and is unlikely to have a significant influence on the weather over the region for the next few months. The formation of IOD typically starts around May or June, and peaks between August and October before decaying rapidly between December and April.

figure13

Figure 13: Indian Ocean Dipole (IOD) index time series. The IOD index is at the neutral level for December 2016. (Source: Bureau of Meteorology).