Review of Regional Weather for March 2020
1. Overview
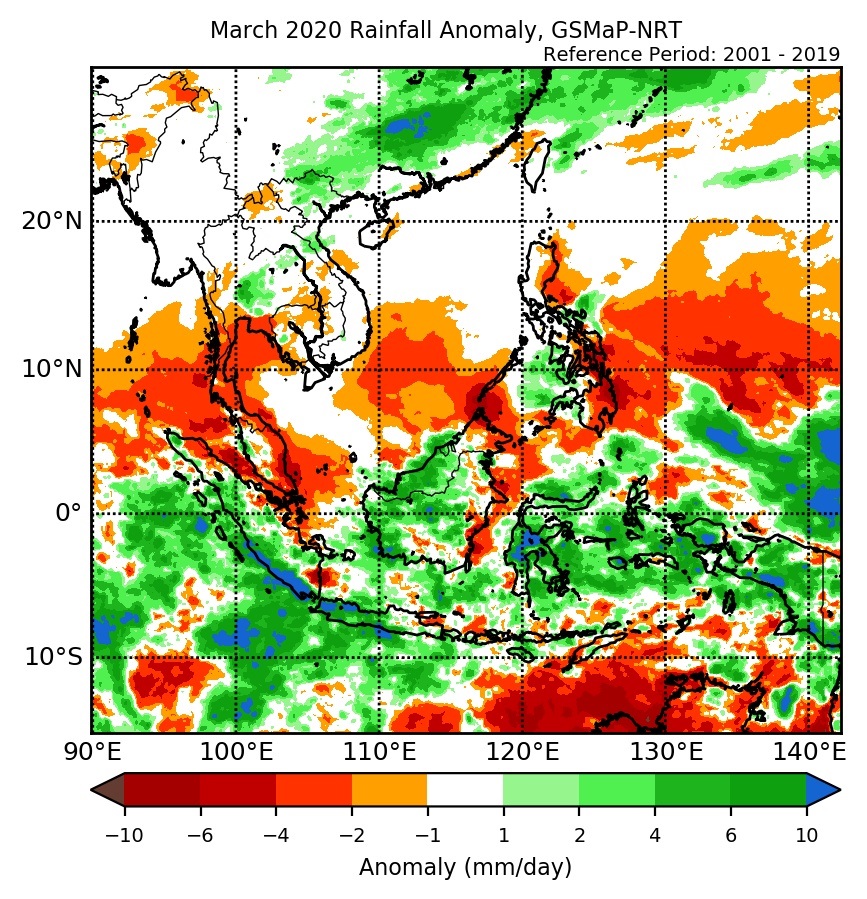
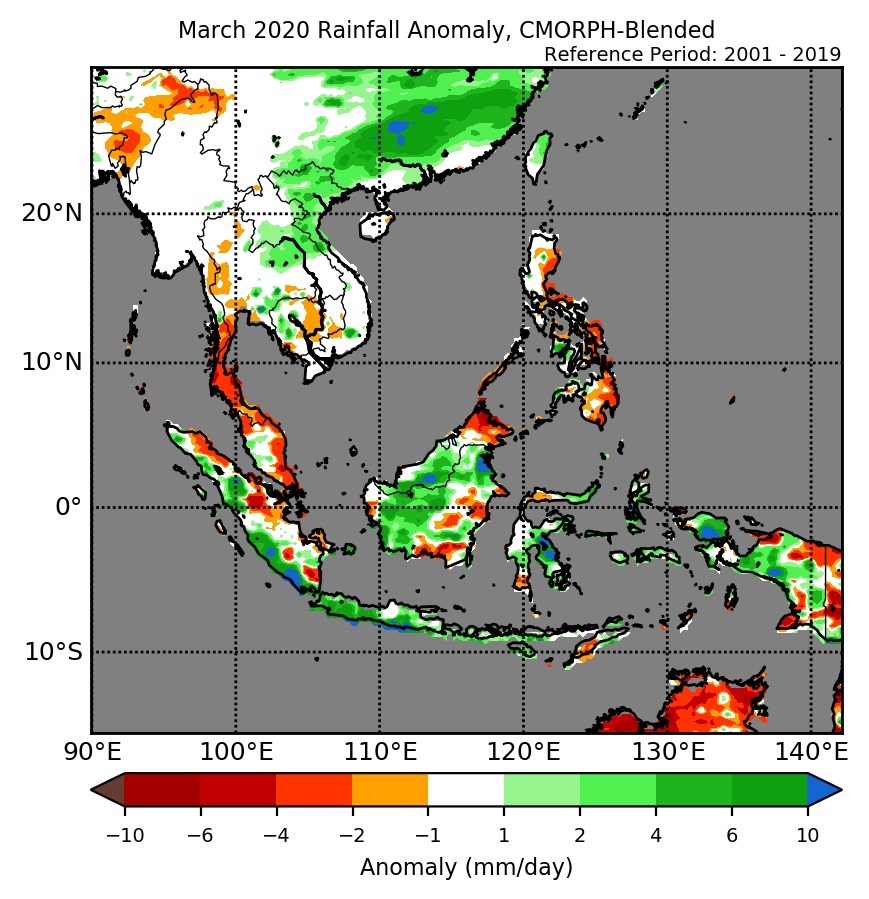
1.1 Much of the region south of the equator experienced above-normal rainfall during March 2020 (Figure 1). In particular, parts of southern Sumatra, West Papua, and central Sulawesi experienced more intense wetter conditions based on both satellite-derived rainfall estimates datasets (GSMaP-NRT and CMORPH-Blended). For north of the equator, below-average rainfall is experienced in most places (between 0°-15°N) over the sea, over the eastern coasts of land masses (Peninsular Malaysia, Borneo, and the Philippines) and southern Thailand. The observed large-scale rainfall anomaly patterns over the Southeast Asia region during March (i.e. wetter to the south, and drier to the north of the equator) are broadly aligned with the model predictions depicted in the subseasonal weather outlooks for the first and second fortnights of March 2020.
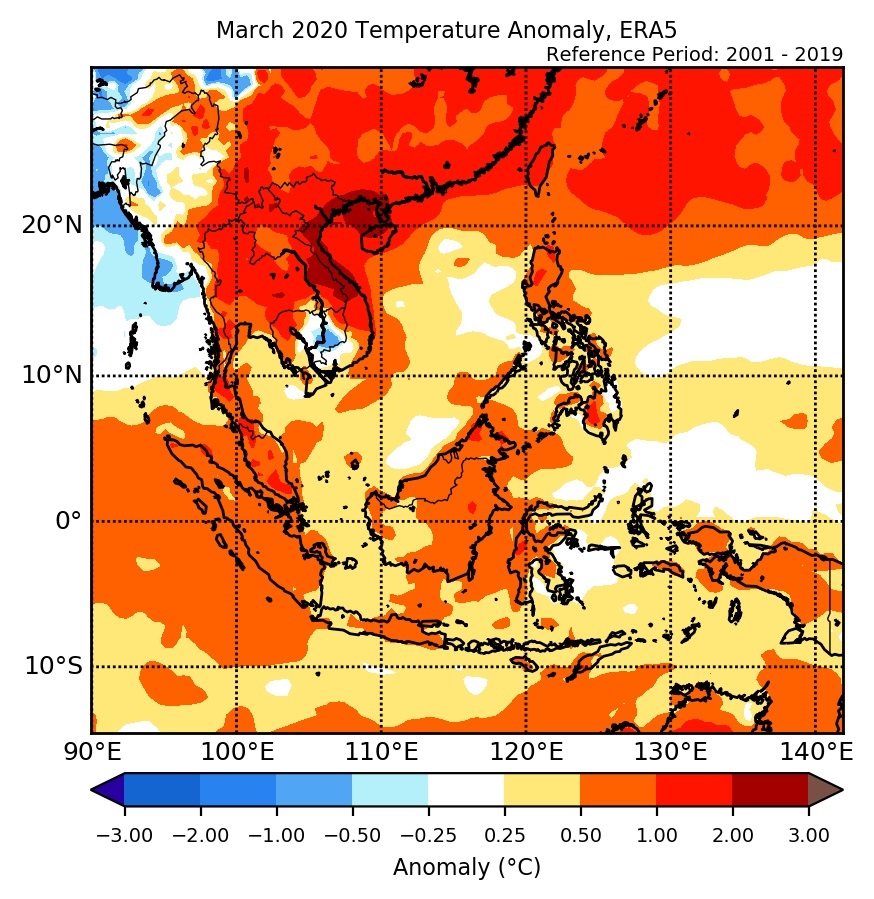
1.2 Most parts of Southeast Asia experienced above-average temperature during March 2020 (Figure 2). The largest warm anomalies occurred over parts of northern and central Viet Nam. Apart from the far eastern, southern, and northern corners, the rest of Myanmar experienced near-normal to below-normal temperature conditions during March 2020.
2. Climate Drivers
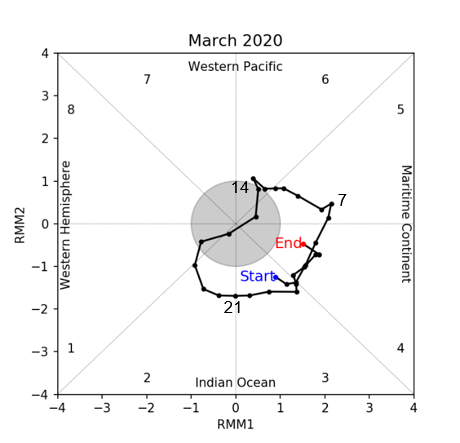
2.1 The Madden-Julian Oscillation (MJO) was active for much of March 2020. The MJO signal propagated eastwards from Phase 3 (Indian Ocean) to Phase 5 (Maritime Continent) during the first two weeks of March. The MJO then re-emerged in the third week in Phase 2 (Indian Ocean) and continued propagating until the end of March in Phase 4 (Maritime Continent). Generally, the phases the MJO went through (Phases 2-5) in March typically bring wetter conditions to many parts of the Maritime Continent, especially the south.