Review of Regional Weather and Smoke Haze for Feb 2018
1. Review of Regional Weather Conditions in February 2018
1.1 In February 2018, Northeast Monsoon conditions continued to prevail over Southeast Asia with the northern ASEAN region still in the midst of the traditional dry season, and the southern ASEAN region experiencing wet weather conditions or it traditional rainy season.
1.2 In the northern ASEAN region, dry weather conditions were felt mostly over Myanmar, Cambodia and parts of Thailand and Vietnam. With the presence of the monsoon trough and its associated rain band lying close to the Equator, most parts of the southern ASEAN region experienced wet weather conditions in February 2018.
1.3 The rainfall distribution for February 2018 and the percent of normal rainfall for February 2018 are shown in Figure 1 and 2.
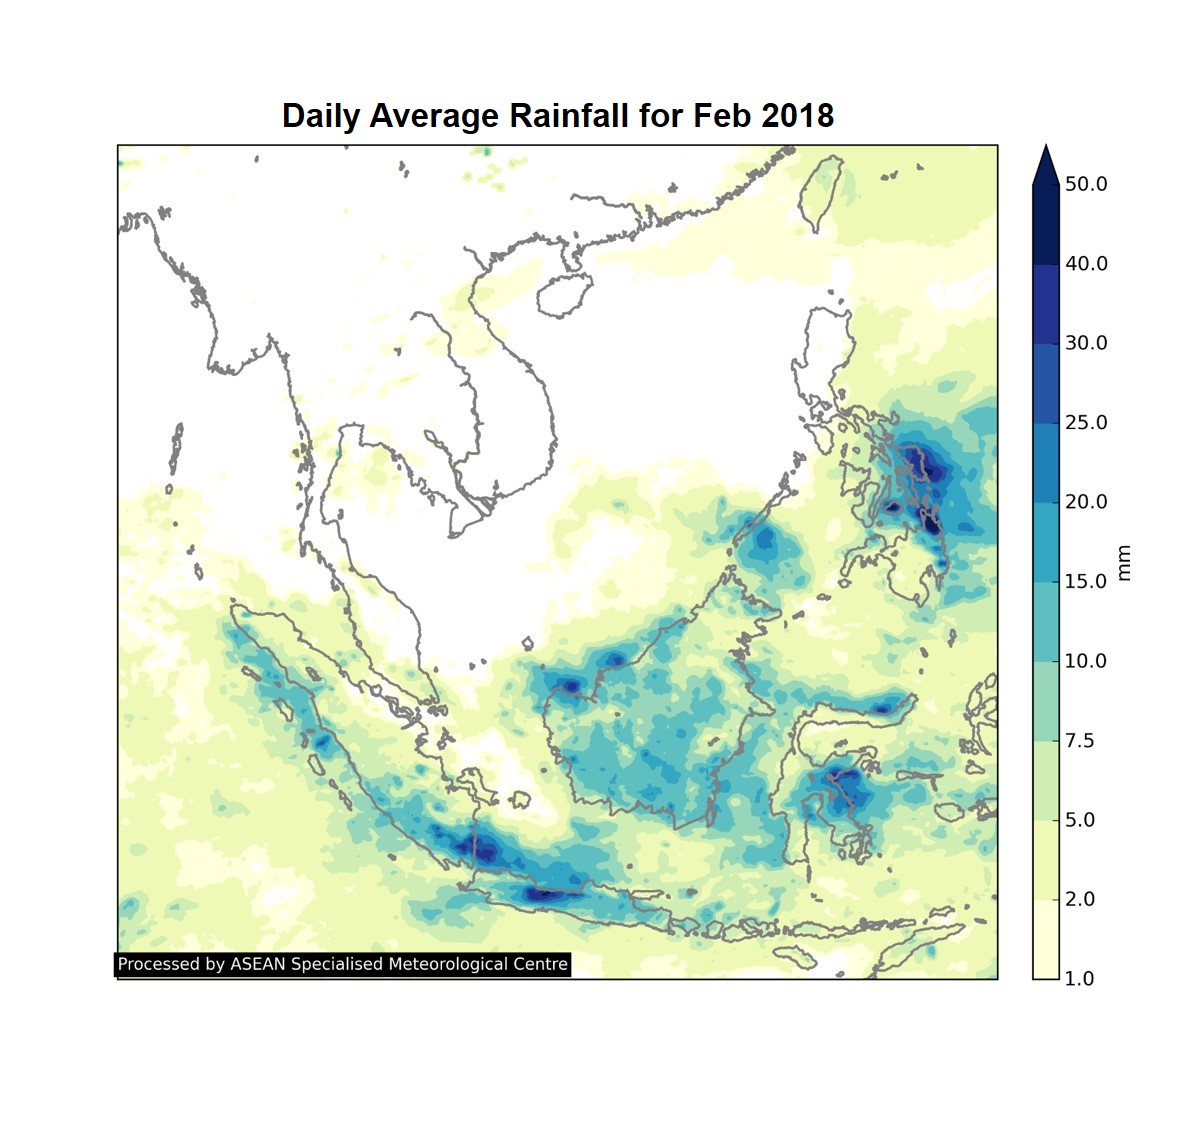
Figure 1: Daily average rainfall for the ASEAN region in February 2018. (Source: JAXA Global Satellite Mapping of Precipitation).
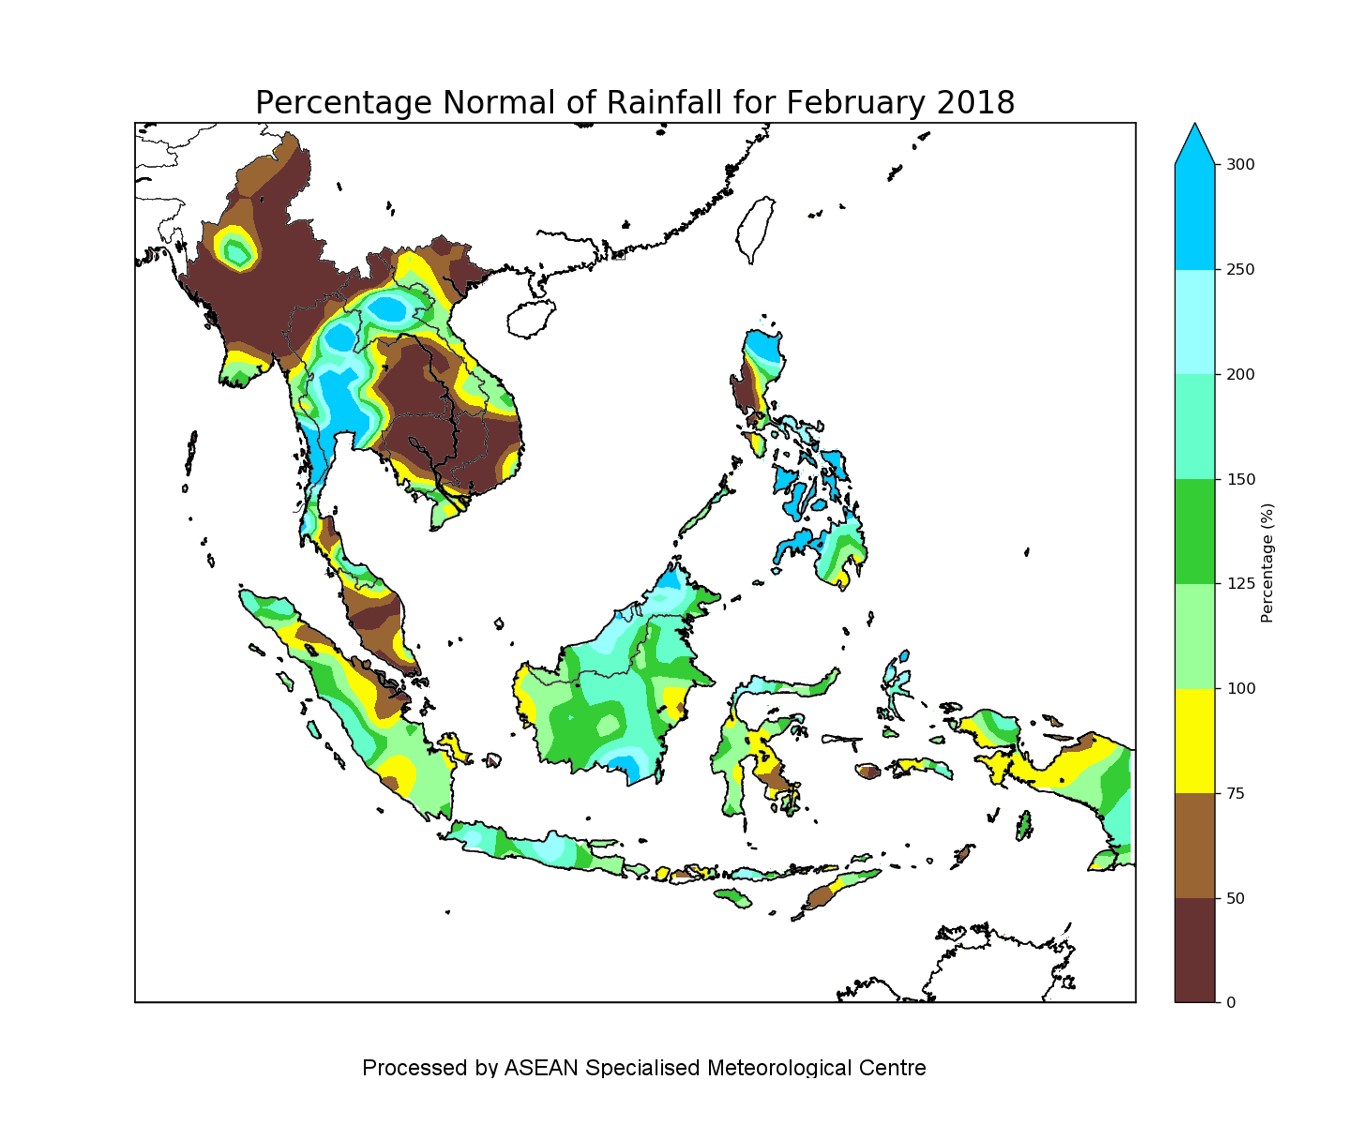
Figure 2: Percent of Normal Rainfall for February 2018. The rainfall data may be less representative for areas with a less dense rainfall network.
1.4 In the first half of February 2018, a mass of dry continental air from the northern Asian landmass brought dry and warm conditions to many parts of Southeast Asia, extending from northern Myanmar to as far south as over southern Peninsular Malaysia, Singapore and central Sumatra. During the first two weeks of February 2018, most of the shower activities fell over parts of Southeast Asia, south of the Equator, and near-normal rainfall was recorded there.
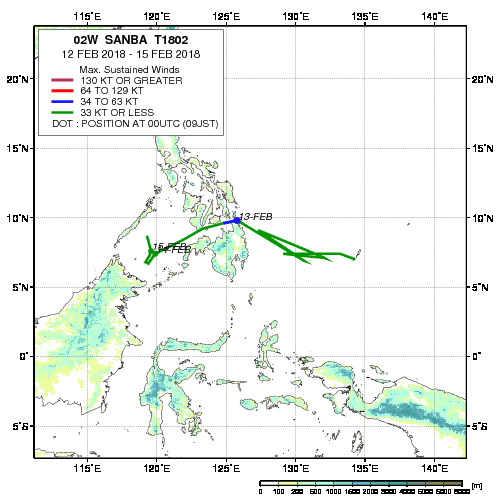
1.5 The tropical cyclone activity in February was low. There was only one tropical cyclone, Tropical Storm “Sanba” which developed on 11 February 2018 over the Pacific Ocean, east of Mindanao, the Philippines. Tropical Storm “Sanba” tracked to the west and made landfall over Mindanao, the Philippines two days later. “Sanba” brought heavy rainfall, strong wind gusts of around 75km/h and landslides in parts of the central and southern Philippines as the storm moved west northwest across the Philippines towards the South China Sea before it dissipated off the coast of Vietnam. Figure 3 shows the storm track of Tropical Storm Sanba.
1.6 In February 2018, the prevailing winds over Southeast Asia, north of the Equator blew predominantly from the northeast or east, while around and to the south of the Equator, the winds were generally from the west or northwest. During the month, there were strong anomalous westerly winds observed between latitudes 10o N and 10o S, and from 120o E to 170oE. Figure 4 shows the average and anomalous winds at 5000 feet.
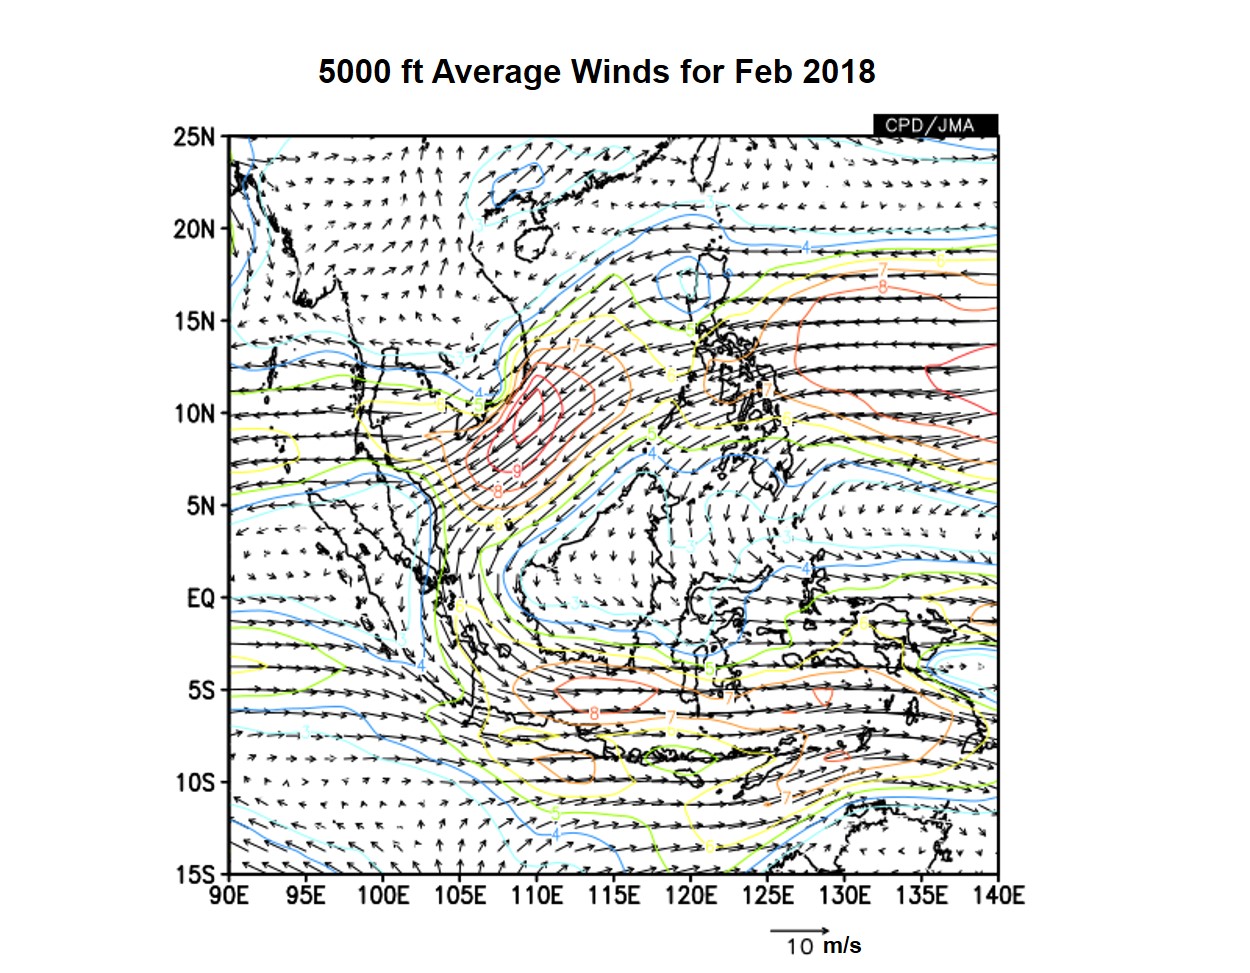
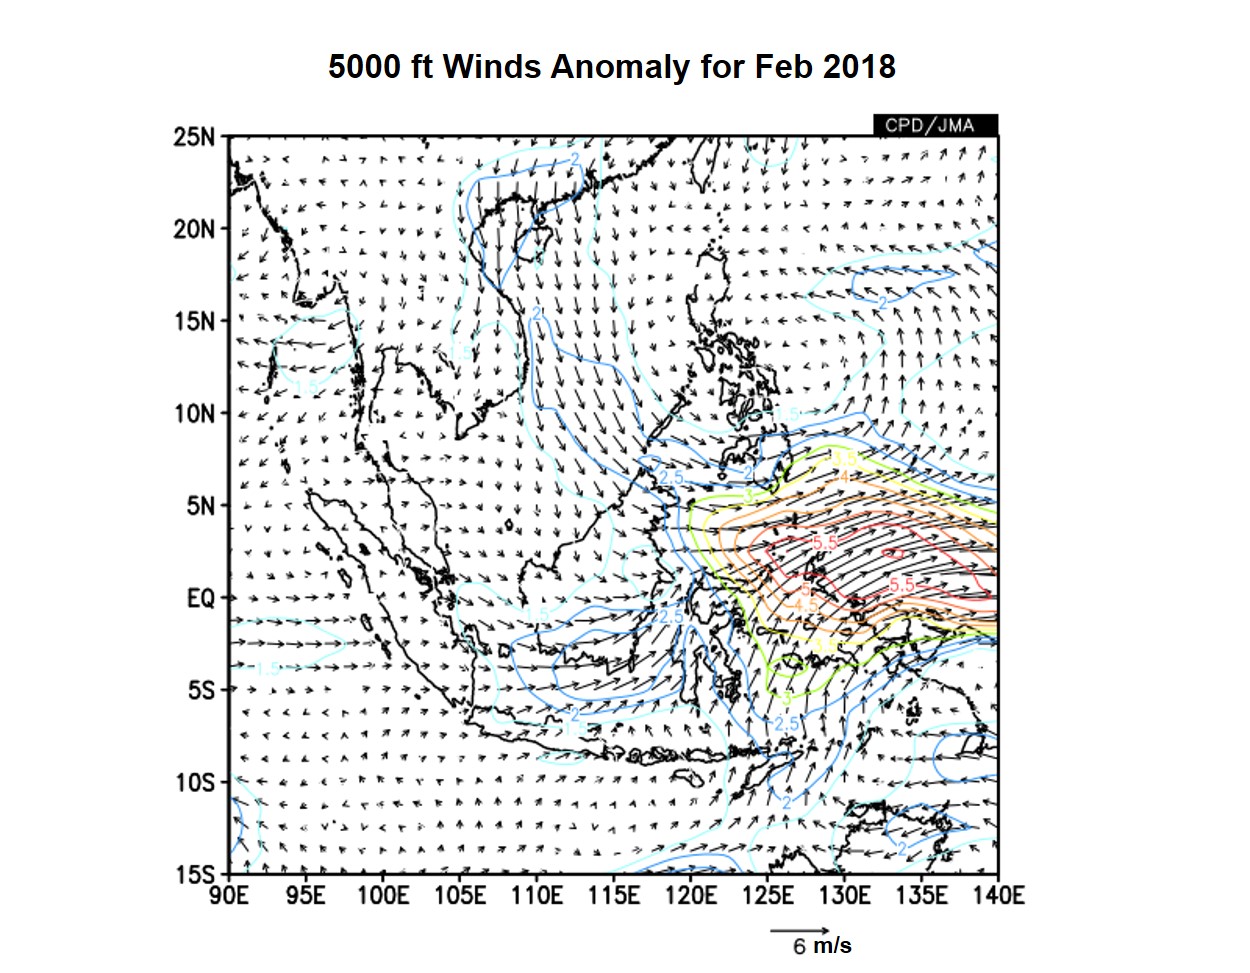
Figure 4: 5000 ft average winds (left) and anomaly (right) for February 2018.
1.7 During the month, the sea surface temperature (SST) over the Niño 3.4 region in the equatorial Pacific Ocean remained at La Niña values, but the cool anomalies showed a gradually declining trend. Cloudiness over the equatorial Pacific Ocean was slightly below average during the month, indicative of a weakening of the La Niña conditions. Although the SST and cloudiness were suggestive of La Niña conditions, the trade winds over the equatorial Pacific Ocean, were observed to be near-normal, partly due to the occurrence of the westerly wind burst associated with the active MJO phase 7 and 8.
1.8 The Madden Julian Oscillation (MJO) was active throughout the month, propagating from a start phase of Phase 7 and ending in Phase 2 towards the end of the month. In addition to the occurrence of the mass of dry and warm air over most parts of Southeast Asia in the first half of February 2018, rainfall in these areas were also suppressed due to the MJO which was in phase 7 and 8. The shift in the MJO to phase 1 and 2 towards the end of the month contributed to an increase in intense organised convection over the eastern Indian Ocean, and brought an increase in shower activities over the southern ASEAN region.
Figure 5: The MJO phase diagram for February 2018 (green). The diagram illustrates the movement of the MJO through different phases, which correspond to different locations along the equator. The distance of the index from the centre of the diagram is correlated with the strength of MJO. When the index falls within the circle, the MJO is considered weak or indiscernible. (Source: Bureau of Meteorology).
2. Review of Land/Forest Fires and Smoke Haze Situation
2.1 In February 2018, the drier weather in the northern ASEAN region led to escalations in hotspot activities, in particular in Cambodia, Lao PDR, Myanmar and parts of northern Thailand. On some days, smoke plumes were seen emanating from some of these hotspots, and the haze from these fire spots affected the air quality in parts of the northern ASEAN region. Several places such as Lampang in northern Thailand reported moderate to unhealthy air quality levels.
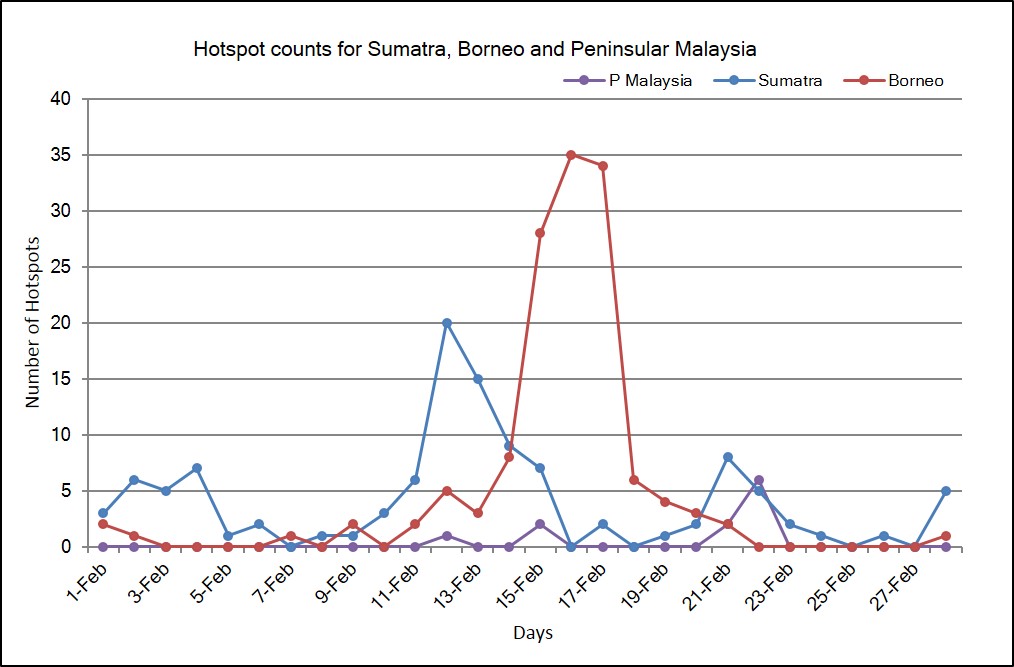
2.2 In the southern ASEAN region, the dry and warm weather experienced in the first two weeks of February 2018 led to an increase in hotspot activities in parts of Sumatra and Kalimantan. The hotspot activities were generally localised and short-lived, and the hotspot activities were subsequently subdued with the return of showers in the region around mid-February 2018.
2.3 Satellite images showing the hotspots detected in the ASEAN region in February 2018 are given in Figure 6 to Figure 9.
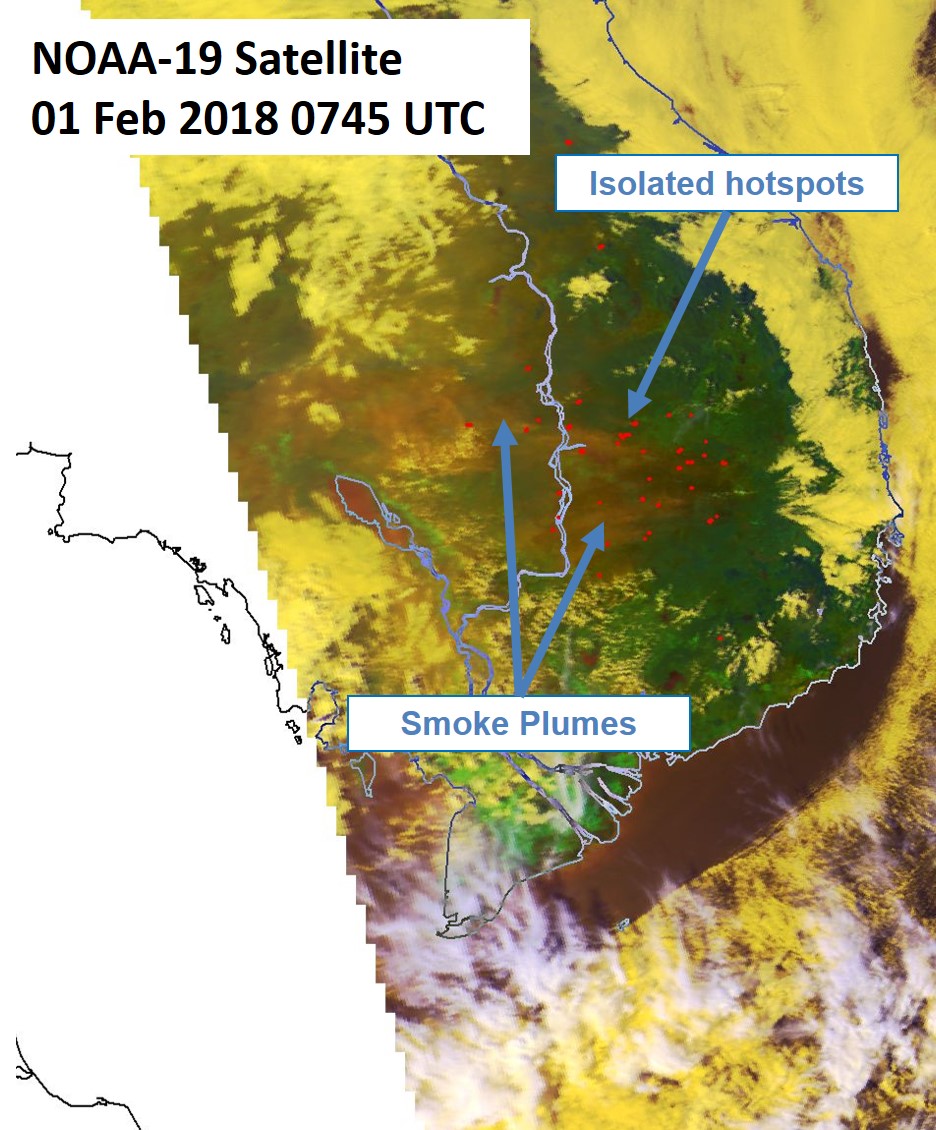
Figure 6: NOAA-19 satellite image on 1 February 2018 shows hotspots over parts of eastern Thailand, Lao PDR and Cambodia. Smoke plumes were observed in the vicinity of some of the hotspots.
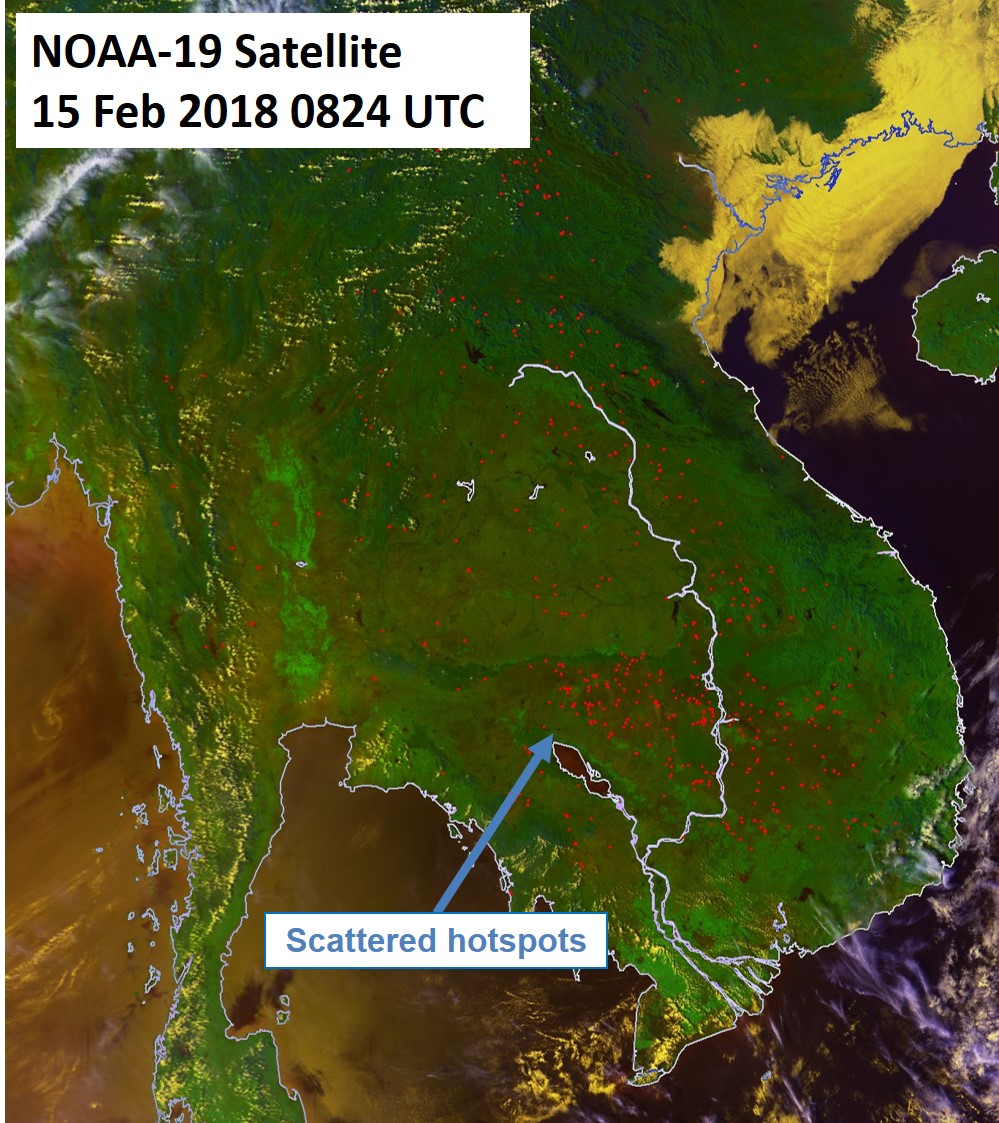
Figure 7: NOAA-19 satellite image on 15 February 2018 shows scattered hotspots over Cambodia.
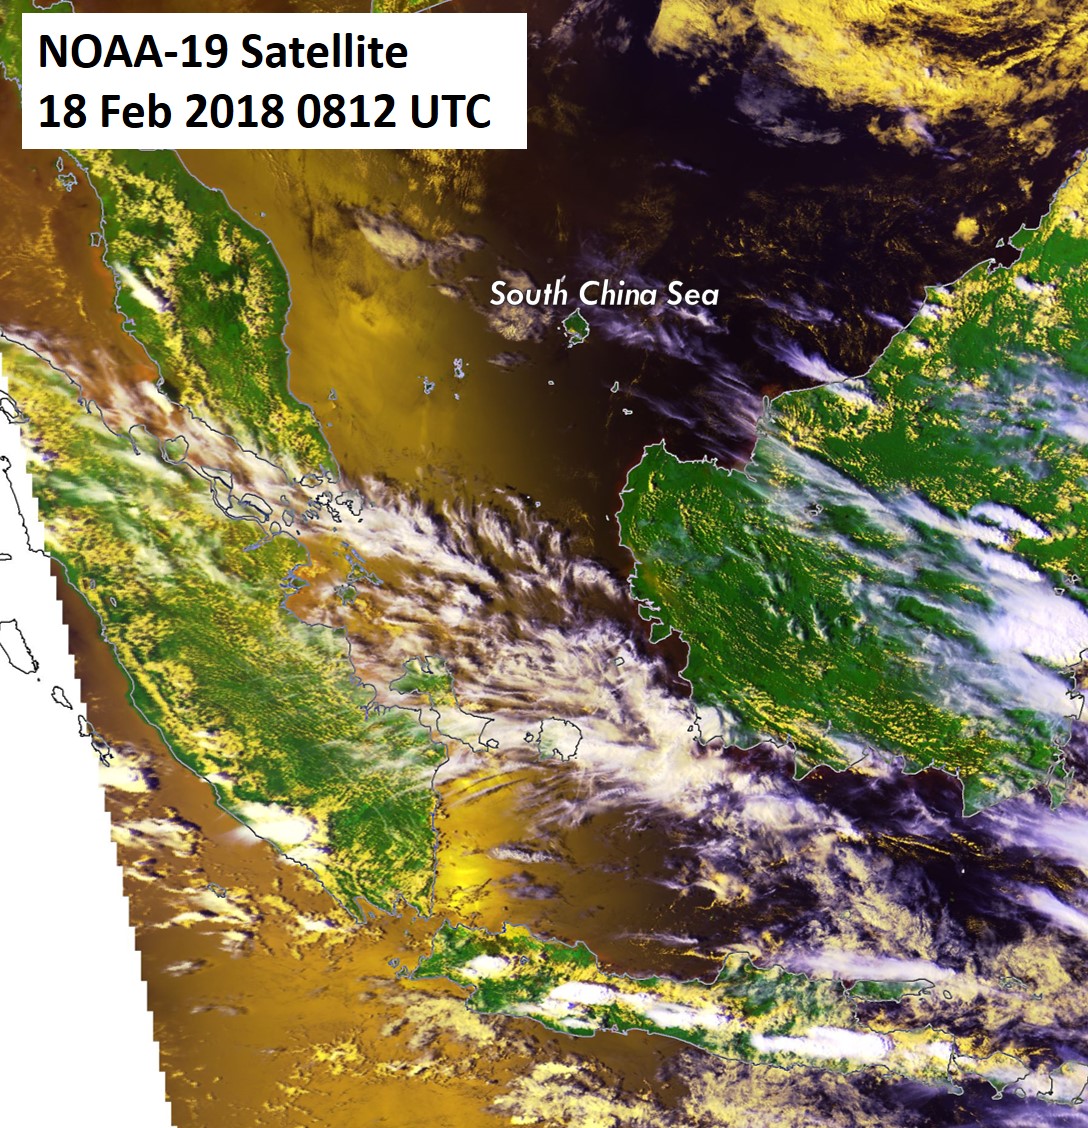
Figure 8: NOAA-19 satellite image on 18 February 2018 shows dry weather conditions over the southern ASEAN region.
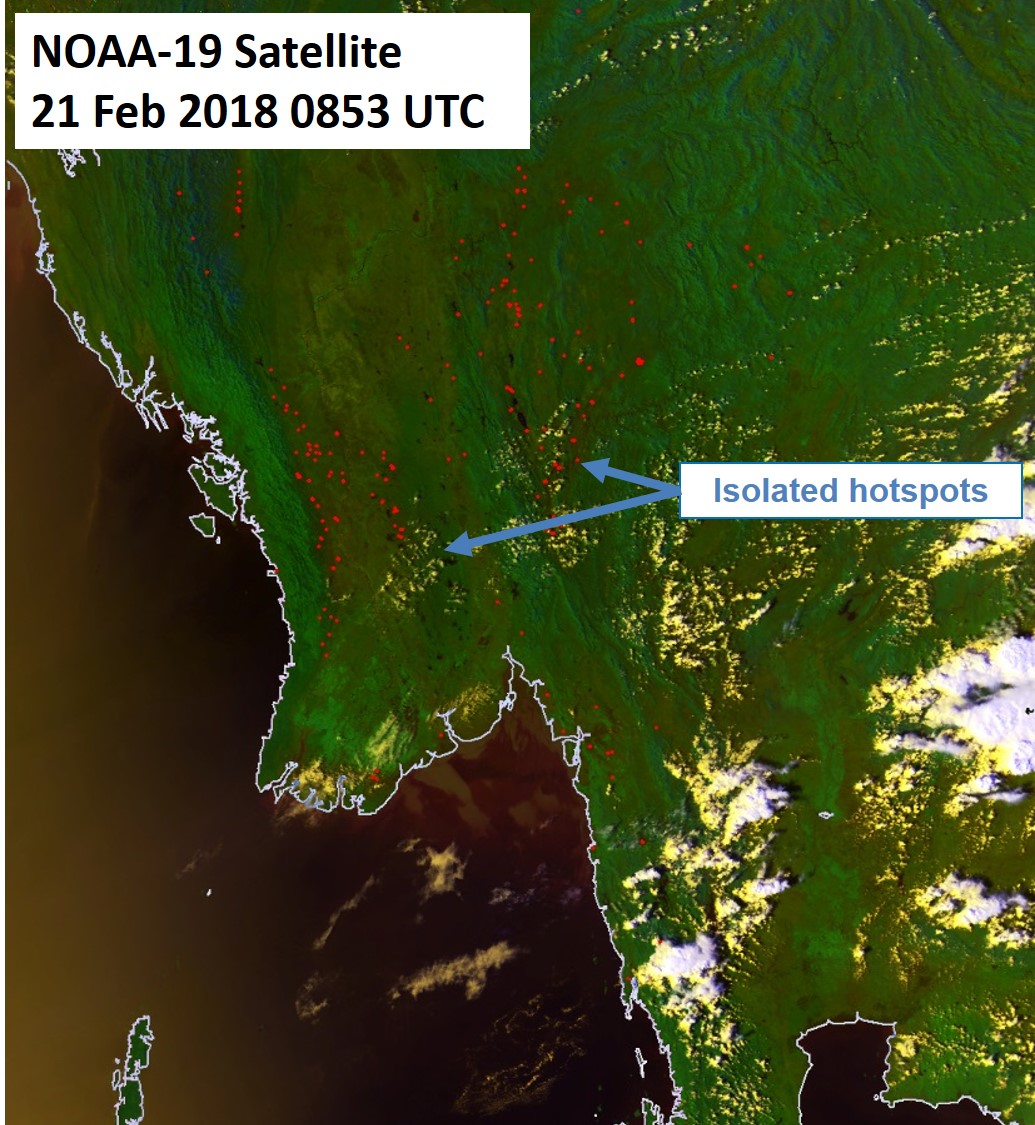
Figure 9: NOAA-19 satellite image on 21 February 2018 shows isolated hotspots over Myanmar.
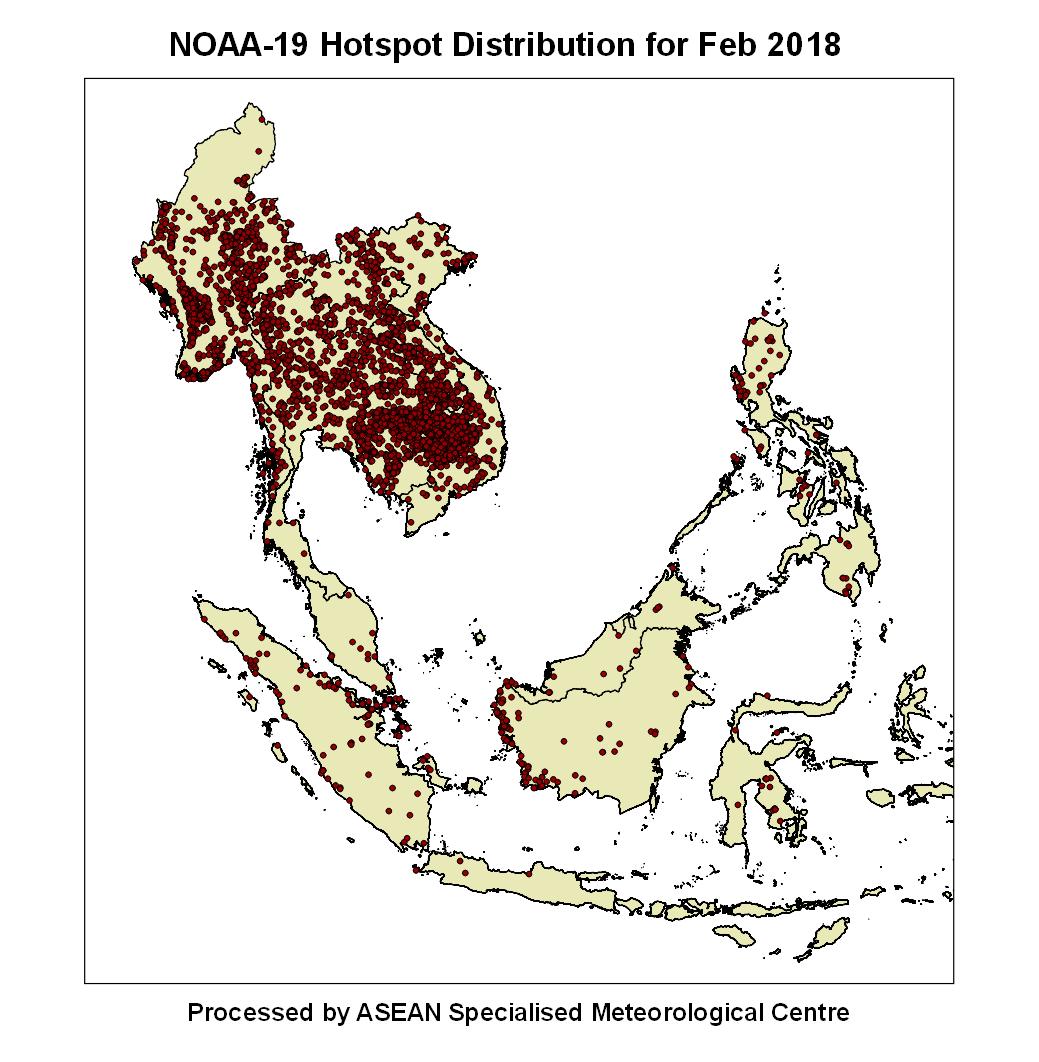
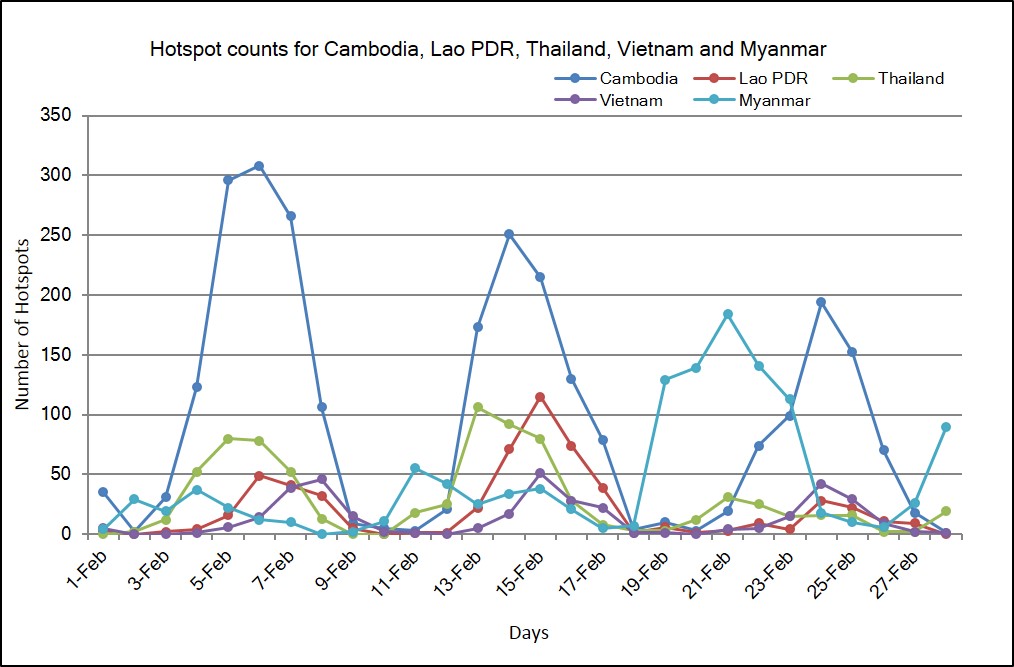
2.4 The hotspot distribution and daily hotspot charts for February 2018 are shown in Figure 10, Figure 11 and Figure 12.
3. Status of El Niño/La Niña and Indian Ocean Dipole
3.1 Based on expert assessments from international climate centres, the prevailing La Niña conditions have been weakening in recent weeks, and a return to neutral (neither El Niño nor La Niña) conditions are expected in April 2018.
3.2 Typically, La Niña brings wetter-than-normal rainfall conditions. During the northeast Monsoon season (Dec – Mar), the impact of La Nina on the weather over the Southeast Asia region is usually less pronounced compared to the Southwest Monsoon season (Jun – Sep), especially for areas in the near-equatorial region.
3.3 In February 2018, the Indian Ocean Dipole (IOD) index remained at neutral levels (Figure 13). In the coming months, international climate models forecast the IOD to remain neutral and it is not likely to have a significant influence on the weather over the region. The formation of IOD typically starts around May or June, and peaks between August and October before decaying rapidly between February and April.
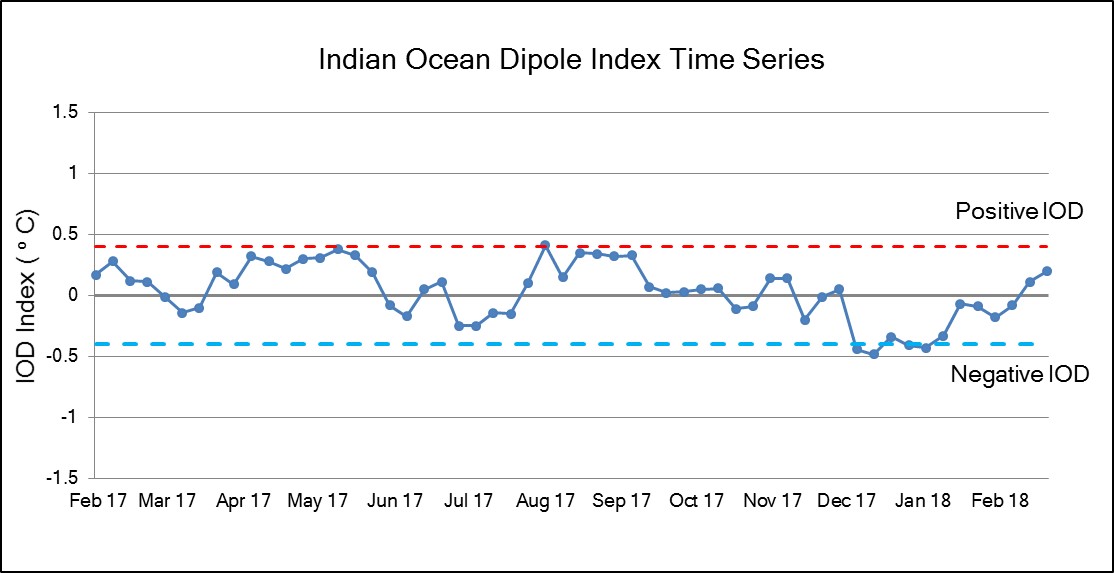
Figure 13: Indian Ocean Dipole (IOD) index time series. The IOD index was at neutral levels in February 2018. (Source: Bureau of Meteorology, Australia).