Review of Regional Weather Conditions for Second Fortnight of March 2019
1. Review of Regional Weather Conditions for Second Fortnight of March 2019
1.1 The Northeast Monsoon season gradually weakened and transitioned to inter-monsoon conditions in the second fortnight of March 2019. The prevailing winds over the Mekong sub-region were generally weak and variable in direction, while that in the southern ASEAN region, were blowing from the southwest and northwest. Over Java, there were westerly and southwesterly anomalies due to low pressure systems that developed south of Java during the fortnight. Figure 1 shows the average and anomalous winds at 5000 feet.
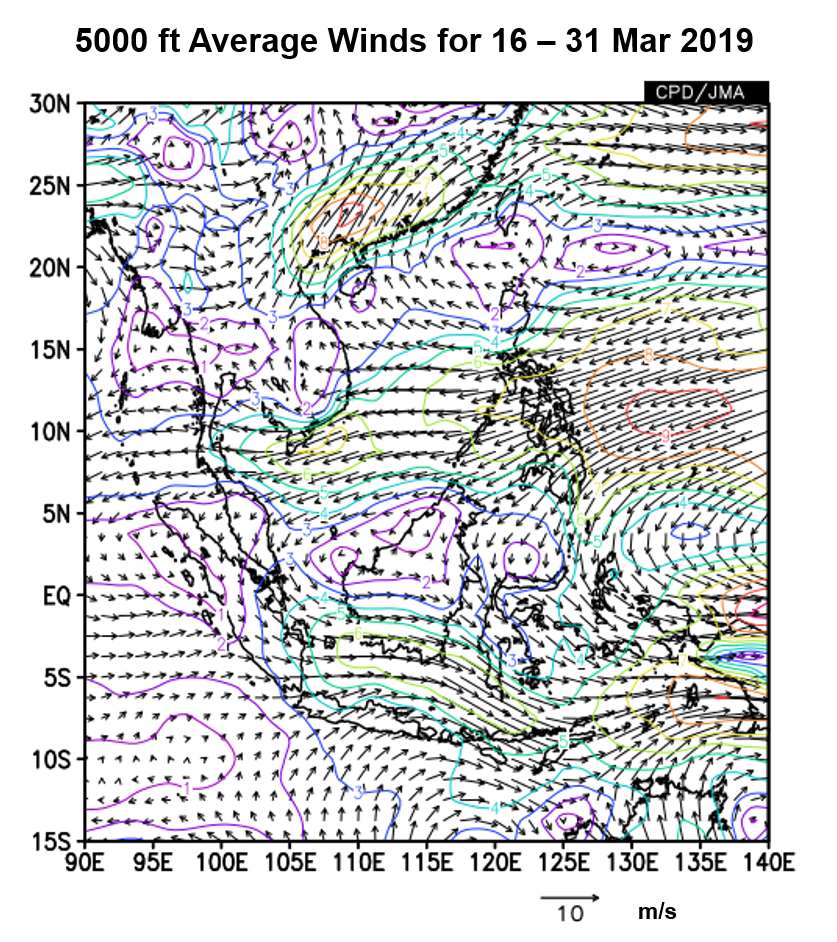

Figure 1: 5000 ft average winds (left) and anomalies (right) for 16 – 31 March 2019. (Source: JMA)
1.2 The transition to inter-monsoon conditions during the latter part of the fortnight brought an increase in rainfall over southern parts of the Mekong sub-region. However, dry conditions prevailed over Myanmar, and the northern parts of Lao PDR and Thailand (Figure 2). In the southern ASEAN region, areas along the equatorial region, including southern Thailand, Peninsular Malaysia, Sarawak, northern and central Sumatra and West Kalimantan received below-average rainfall under the influence of a persistent dry air mass extending from the Pacific Ocean over the Southeast Asia region (Figure 3).
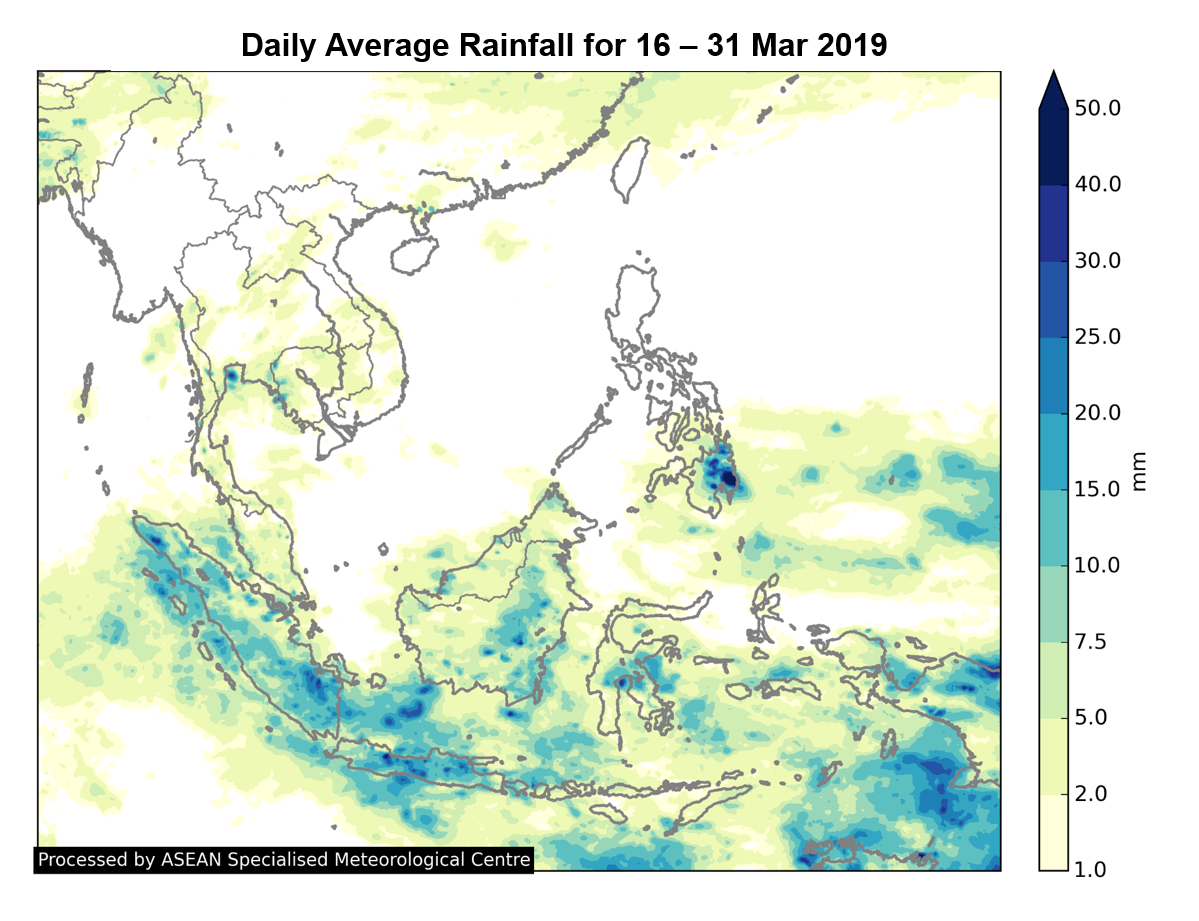
Figure 2: Daily average rainfall for the ASEAN region in the second fortnight of March 2019. (Source: JAXA Global Satellite Mapping of Precipitation)
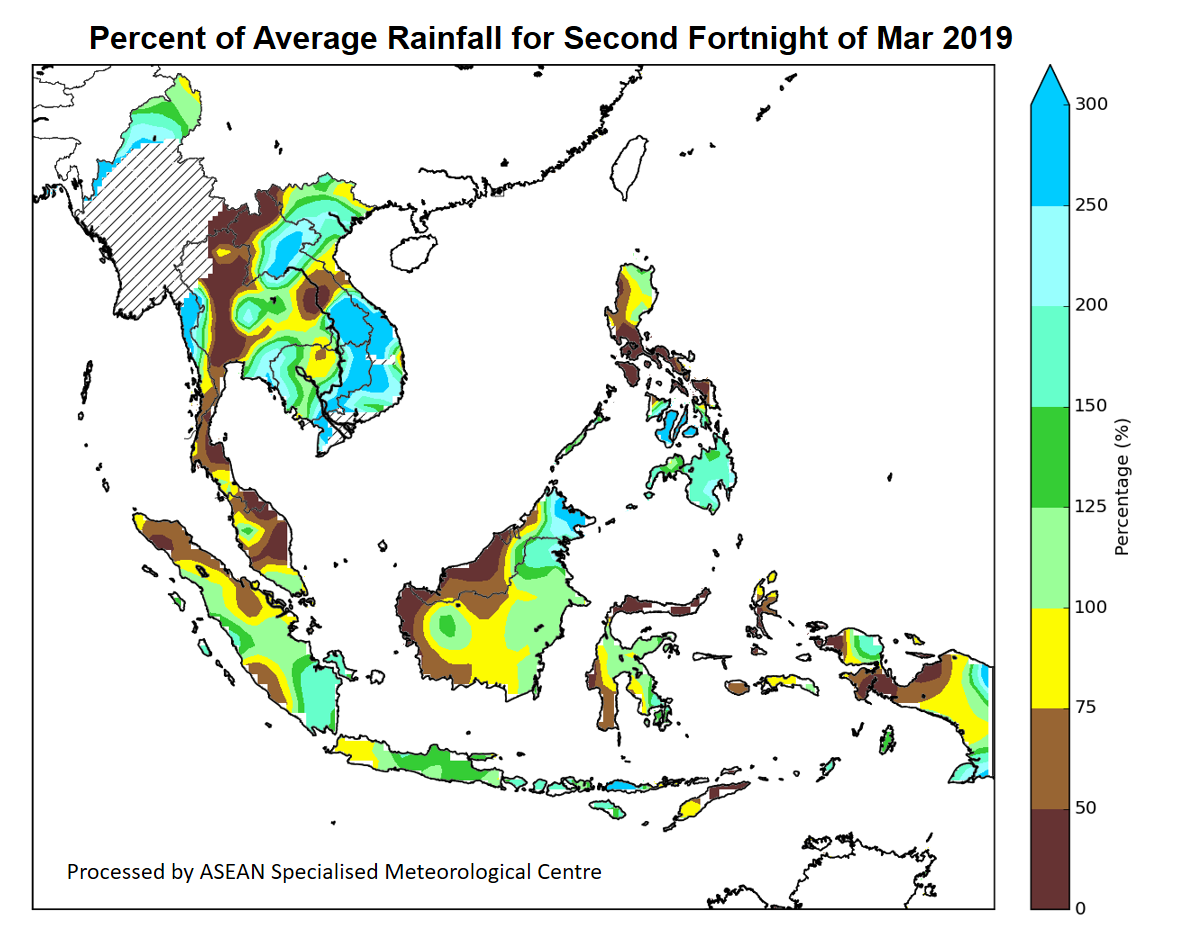
Figure 3: Percent of average rainfall for 16 – 31 March 2019. The rainfall data may be less representative for areas with a less dense rainfall network. Hatched areas indicate climatology dry mask (average daily rainfall below 1 mm). (Source: IRI NOAA/NCEP CPC Unified Precipitation Analyses)
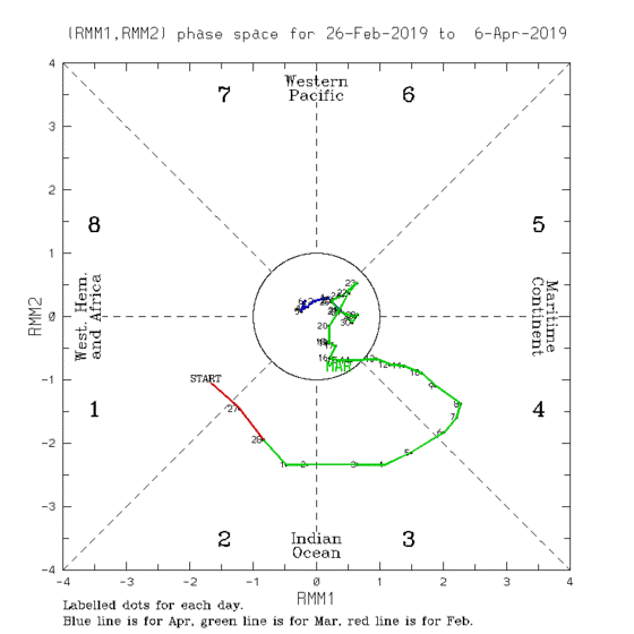
1.3 The Madden-Julian Oscillation (MJO) signal remained weak during the second fortnight of March 2019 and had no significant influence on the weather over the ASEAN region (Figure 4).
1.4 The sea surface temperatures over the tropical Pacific Ocean Nino 3.4 region were warm and close to the El Niño thresholds. However, there was little atmospheric response observed, such as the lack of consistent weaker-than-average trade winds and large-scale rainfall patterns over the tropical Pacific.